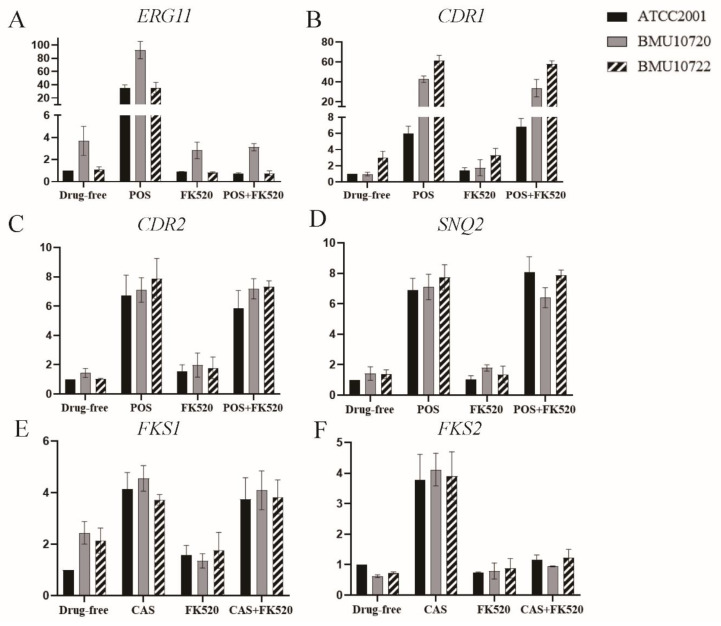
Figure 2.
The expression level of resistance-related genes in ATCC2001, BMU10720, and BMU10722. For each target gene, the relative amount of expression was compared to that of RDN5.8 as an internal control. The treatment of each group in detail was in the text. Data presented as means ± SE (error bars) from biological triplicates with technical triplicates. Expression data were assessed by two-way ANOVA. POS, posaconazole; CAS, caspofungin. (A) At basal level, the expression level of ERG11 in BMU10720 was 4.35-fold higher than that in C. glabrata ATCC2001 (p < 0.01), while that of BMU10722 was comparable to ATCC2001 (1.12-fold vs. 1-fold, p > 0.99). When exposed to POS alone, the expression level of ERG11 in BMU10720 was significantly higher than ATCC2001 (92.3-fold vs. 35.3-fold, p < 0.0001), while that of BMU10722 was comparable to ATCC2001 (35.1-fold vs. 35.3-fold, p > 0.99). FK520 alone did not change the expression level of ERG11. The combination of FK520 and POS sharply down-regulated ERG11 compared to POS alone in ATCC2001, BMU10720, and BMU10722 (0.71-fold vs. 35.3-fold, p < 0.0001, 3.1-fold vs. 92.3-fold, p < 0.0001, and 0.75-fold vs. 35.1-fold, p < 0.0001, respectively). (B) At basal level, the expression level of CDR1 in BMU10722 was 3.01-fold higher than that in C. glabrata ATCC2001 (p < 0.01), while that of BMU10720 was comparable to ATCC2001 (0.97-fold vs. 1-fold, p > 0.99). When exposed to POS alone, the expression level of CDR1 in BMU10720 and BMU10722 was significantly higher than ATCC2001 (42.64-fold vs. 5.98-fold, p < 0.0001 and 61.31-fold vs. 5.98-fold, p < 0.0001, respectively). FK520 did not change the expression level of CDR1 either in the absence or presence of POS in three isolates. (C) The expression level of CDR2 was comparable in BMU10720 and BMU10722 compared to ATCC2001 at basal level (1.44-fold vs. 1-fold, p > 0.99 and 1.04-fold vs. 1-fold, p > 0.99, respectively). POS up-regulated CDR2 in three isolates to a comparable level (7.11-fold vs. 6.73-fold, p > 0.99 and 7.88-fold vs. 6.73-fold, p = 0.85, respectively). FK520 did not change the expression level of CDR2 either in the absence or presence of POS in three isolates. (D) The expression level of SNQ2 was comparable in BMU10720 and BMU10722 compared to ATCC2001 at basal level (1.42-fold vs. 1-fold, p > 0.99 and 1.37-fold vs. 1-fold, p > 0.99, respectively). POS up-regulated SNQ2 in three isolates to a comparable level (7.73-fold vs. 6.90-fold, p > 0.99 and 6.13-fold vs. 6.90-fold, p = 0.85, respectively). FK520 did not change the expression level of SNQ2 either in the absence or presence of POS in three isolates. (E) The expression level of FKS1 was comparable in BMU10720 and BMU10722 compared to ATCC2001 at basal level (2.44-fold vs. 1-fold, p = 0.11 and 2.14-fold vs. 1-fold, p = 0.35, respectively). CAS up-regulated FKS1 in three isolates to a comparable level (4.56-fold vs. 4.13-fold, p > 0.99 and 3.72-fold vs. 4.13-fold, p > 0.99, respectively). FK520 did not change the expression level of FKS1 either in the absence or presence CAS in three isolates. (F) The expression level of FKS2 was comparable in BMU10720 and BMU10722 compared to ATCC2001 at basal level (0.62-fold vs. 1-fold, p = 0.99 and 0.73-fold vs. 1-fold, p > 0.99, respectively). CAS up-regulated FKS2 in three isolates to a comparable level (4.12-fold vs. 3.78-fold, p > 0.99 and 3.91-fold vs. 3.78-fold, p > 0.99, respectively). FK520 alone did not change the expression level of FKS2. The combination of FK520 and CAS sharply down-regulated FKS2 compared to CAS alone in ATCC2001, BMU10720, and BMU10722 (1.61-fold vs. 3.78-fold, p < 0.0001, 0.94-fold vs. 4.12-fold, p < 0.0001, and 1.23-fold vs. 3.91-fold, p < 0.0001, respectively).

