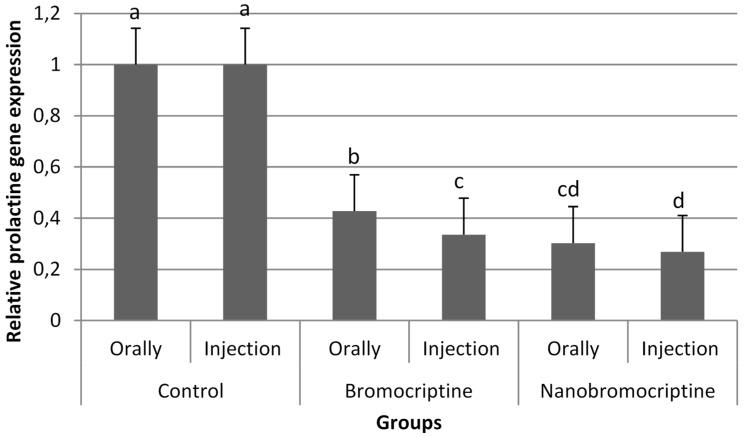
Figure 4.
Quantitative gene expression of prolactin gene in pituitary after either bromocriptine or nano-bromocriptine administration. The qRT-PCR data were normalized relative to the expression of glyceraldehyde-3-phosphate dehydrogenase (GAPDH) as endogenous control and calculated using the method (n = 5). Different superscripts indicated significant differences at p < 0.05. Error bars indicate the standard error of the mean.

