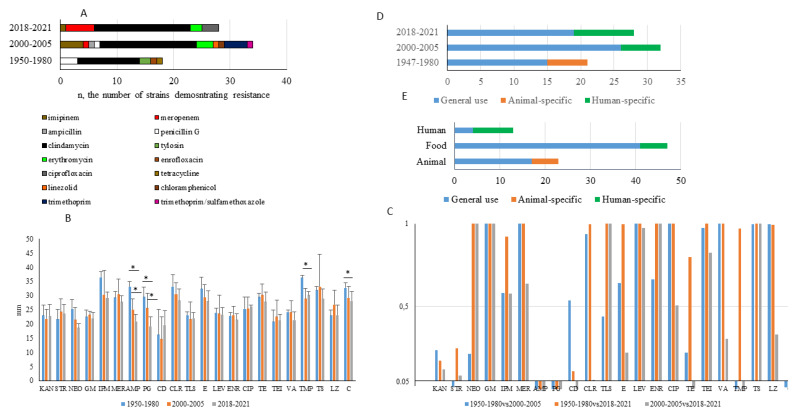
Figure 3.
Temporal changes in antibiotic resistance patterns. (A)—resistance distribution relative to the year of isolation; (B)—inhibition zones; mean values in mm are shown and compared using a t-test; *—p < 0.05; (C)—χ2 testing of hypothesis on similarity of data arrays describing growth inhibition zone for strains isolated in different time periods, the cut point is 0.05 (the abscissa axis intersects the ordinate axis at the point 0.05); (D)—distribution of antibiotic resistance depending on antibiotic applicability (general use, human only, or animal only) relative to the year of isolation; (E)—distribution of antibiotic resistance depending on antibiotic applicability relative to the source of strain isolation. KAN—kanamycin, STR—streptomycin, NEO—neomycin, GM—gentamicin, IPM—imipenem, MER—meropenem, AMP—ampicillin, PG—penicillin G, CD—clindamycin, CLR—clarithromycin, TLS—tylosin, E—erythromycin, LEV—levofloxacin, ENR—enrofloxacin, CIP—ciprofloxacin, TE—tetracycline, TEI—teicoplanin, VA—vancomycin, TMP—trimethoprim, TS—trimethoprim/sulfamethoxazole, LZ—linezolid, C—chloramphenicol.

