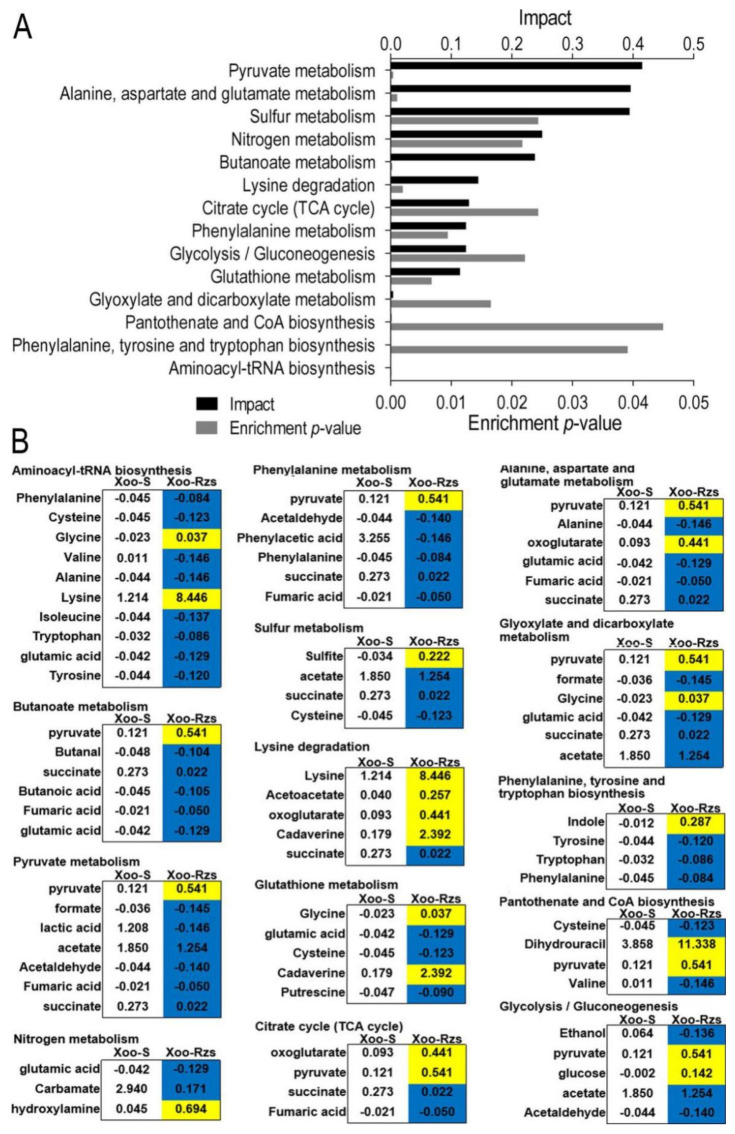
Figure 3.
Pathway analysis. (A) Pathway enrichment of differentially abundant metabolites. (B) Integrative analysis of differentially abundant metabolites in significantly enriched pathways. Yellow and blue indicate the increase and decrease in metabolites, respectively. The numbers show the relative abundance of metabolites in Xoo-S or Xoo-Rzs.

