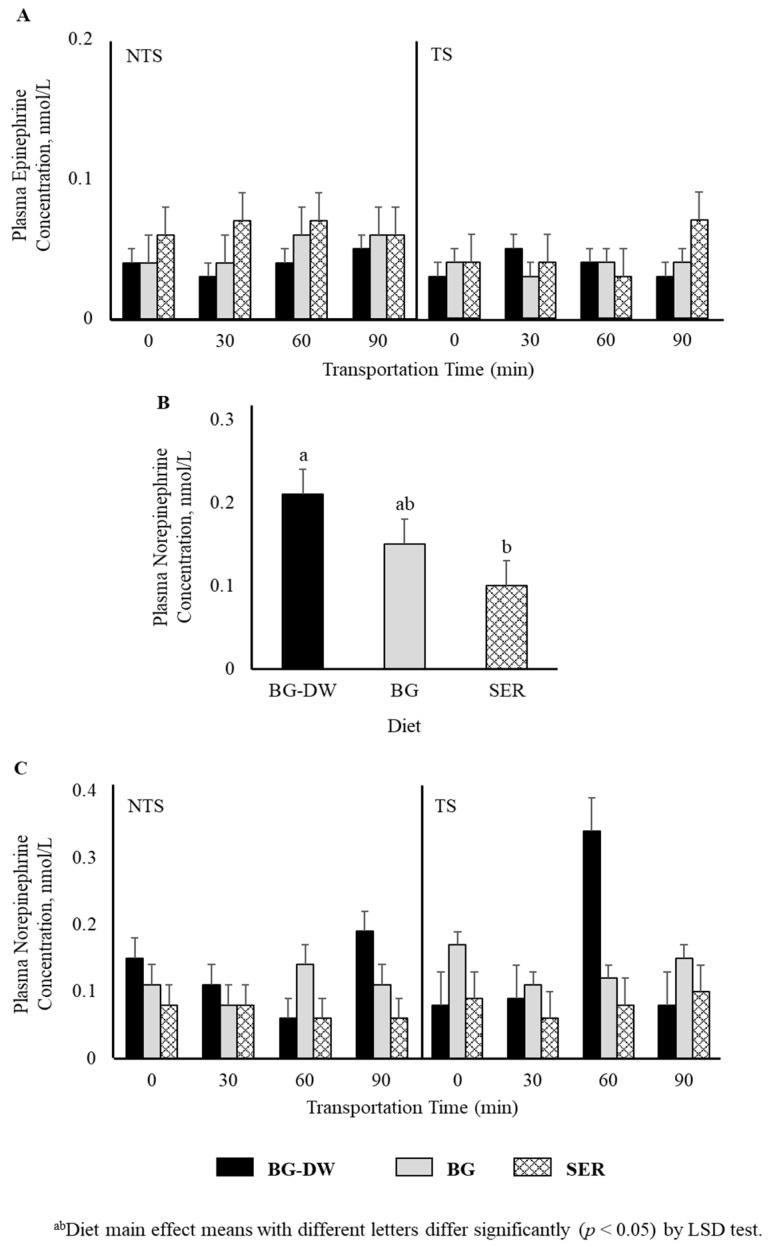
Figure 2.
Effects of Diet (BG-DW: bermudagrass hay—dewormed; BG: bermudagrass hay; SER: sericea hay), Stress Treatment (ST; NTS: non-transported; TS: transported), and Time on plasma (A) epinephrine and (B,C) norepinephrine (Diet, p < 0.05; Diet × ST × Time, p < 0.01) concentrations in goats. Bars represent means with SEM.

