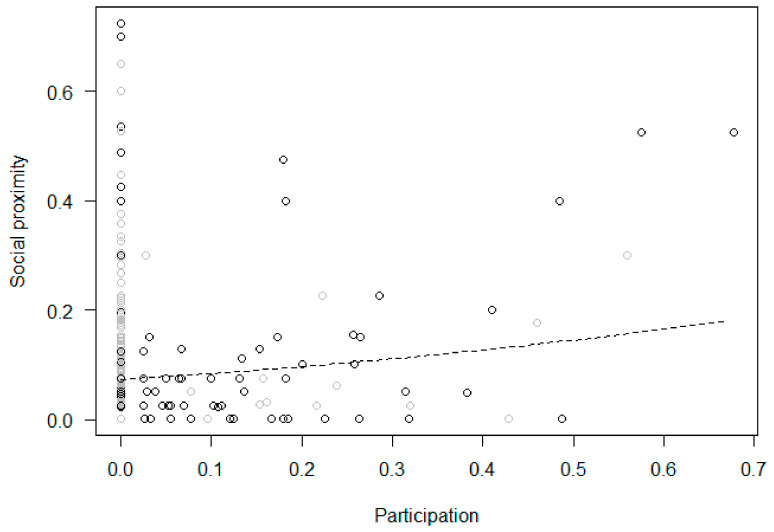
Figure 8.
Social proximity (i.e., proportion of scans an individual was in social proximity, out of the total number of scans in which the subject was visible) as a function of participation (i.e., proportion of scans an individual interacted with the enrichment device in an enrichment session) during the treatment phase. Circles represent individual responses in each enrichment session in the morning (in black) and afternoon (in grey). The dashed line represents the fitted model, which is like Model 7b but unconditional on all the other predictors that were standardized.

