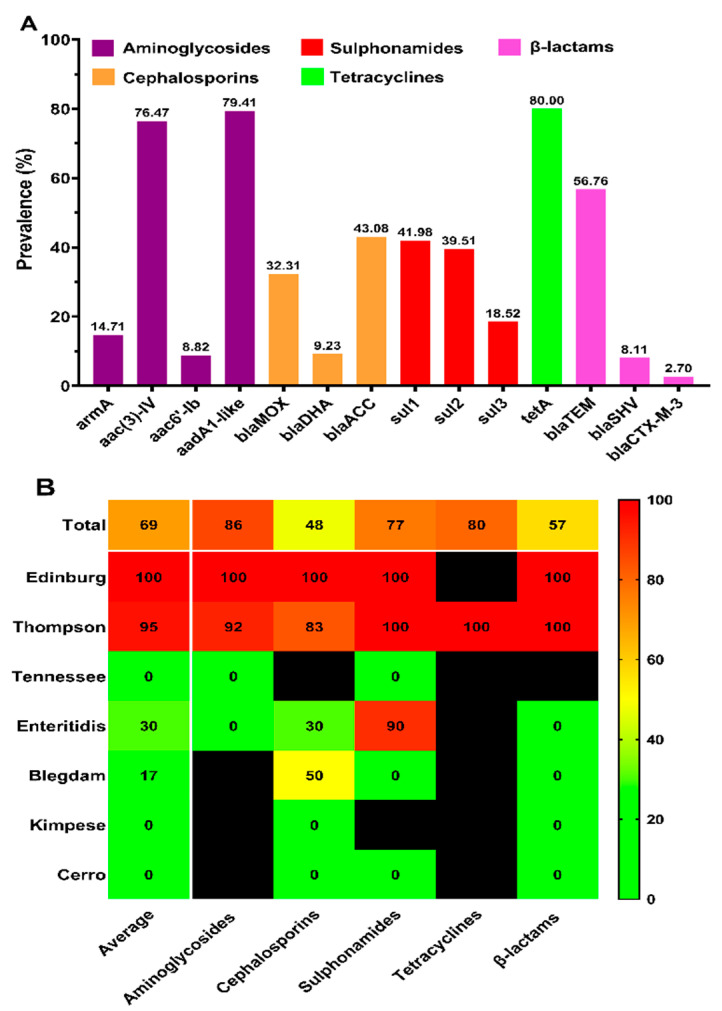
Figure 4.
Phenotype-genotype concordance of antimicrobial resistance. (A) Prevalence of genotypic drug-resistance among Salmonella isolates possessing corresponding phenotypic drug-resistance. Resistant genes belonging to the same class of resistant phenotypes are shown in the same color; (B) serovar distribution of concordance between genotypic and phenotypic drug resistance. Each column represents a resistance category, except the first column, which averages the concordance between the genotype and phenotype of the five categories. Due to the small sample size of S. Entebbe, S. Tamilnadu, S. Fillmore, and S. Gatuni, each serovar had only one strain, so we only analyzed the remaining seven serovars with relatively large sample sizes. The color of the individual cells varies with the percentage of phenotype–genotype concordance shown in the cells. Cells represented by black mean that the corresponding serovar was phenotypically susceptible and was not tested for the presence of the corresponding resistance genes; thus, the concordance percentage was not calculated.

