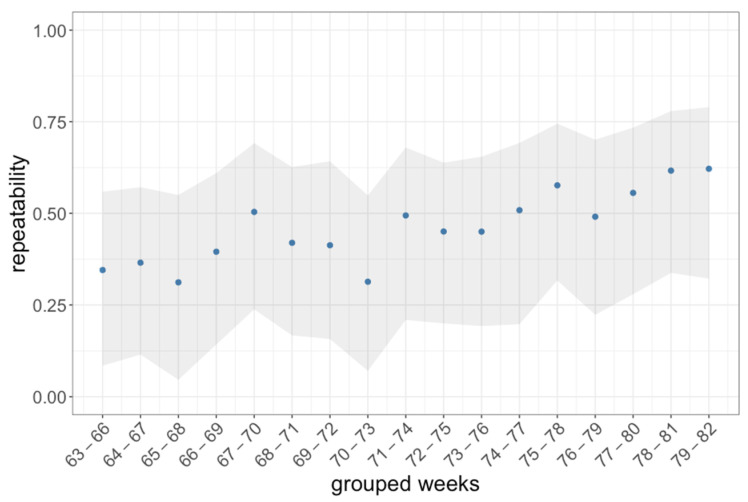
Figure 8.
Calculated repeatability for the RE with the animal ID as a random factor. Each repeatability value (R, blue dots) was calculated over time periods of four weeks resulting in 17 groupings. The repeatability was estimated with a linear model. The grey areas depict the confidence intervals (2.5% and 97.5%) resulting from 500 bootstrapping runs and 100 permutations (R package ‘rptR’, function ‘rpt()’).

