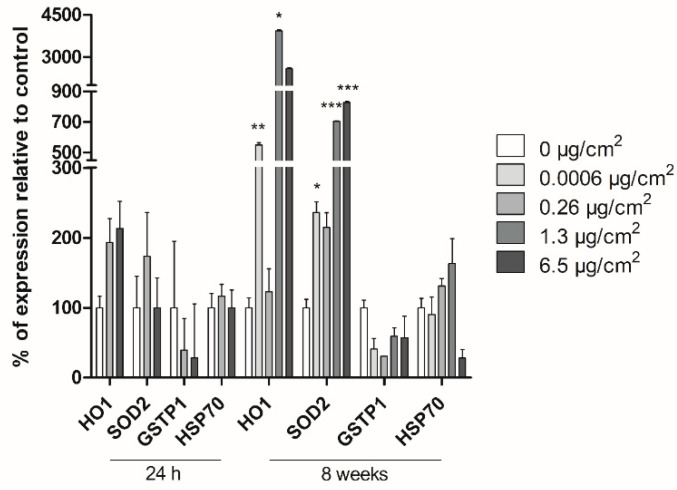
Figure 6.
Study of Caco-2 cells’ response after 24 h and 8 weeks of PSNPs exposure using Real-Time RT-PCR. The percentage of expression for each gene is shown compared to untreated controls, per dose and gene. Data are presented as mean ± SEM for each treatment dose and analyzed by the student’s t-test. * p ≤ 0.05, ** p ≤ 0.01, *** p ≤ 0.001.

