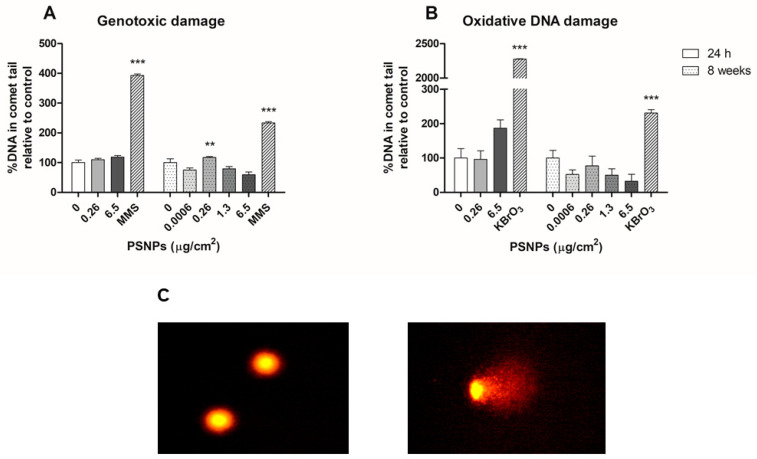
Figure 7.
Genotoxic (A) and oxidative (B) DNA damage in Caco-2 cells after 24 h and 8 weeks of PSNPs exposure, as evidenced by comet assay. Data represent the percentage of DNA in comet tails, relative to that of unexposed controls as mean ± SEM. Statistical significance was determined by one-way ANOVA with Dunnett’s multiple comparison post-test. Comet figures (C) of undamaged cells (left) and damaged cell (right). ** p ≤ 0.01, *** p ≤ 0.001.

