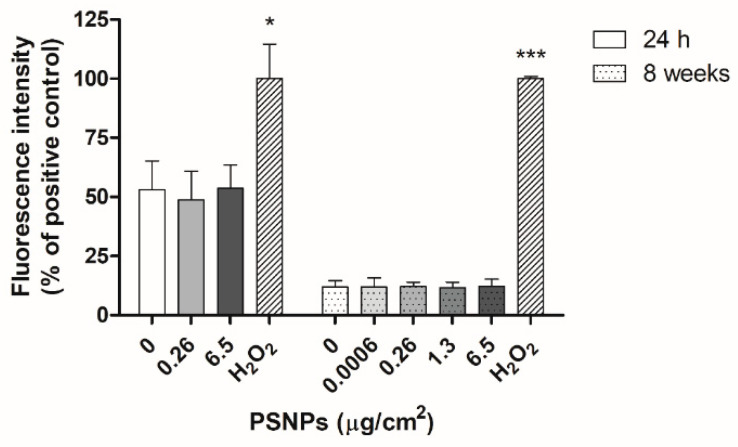
Figure 8.
Presence of intracellular ROS levels as detected by DCFH-DA fluorescence assay in cells exposed to PSNPs for 24 h and 8 weeks, untreated controls, and positive controls treated with H2O2. The percentage of fluorescence intensity relative to the positive control is shown. Data are represented as mean ± SEM for each exposure concentration and analyzed by one-way ANOVA with Dunnett’s multiple comparison post-test. * p ≤ 0.05, *** p ≤ 0.001.

