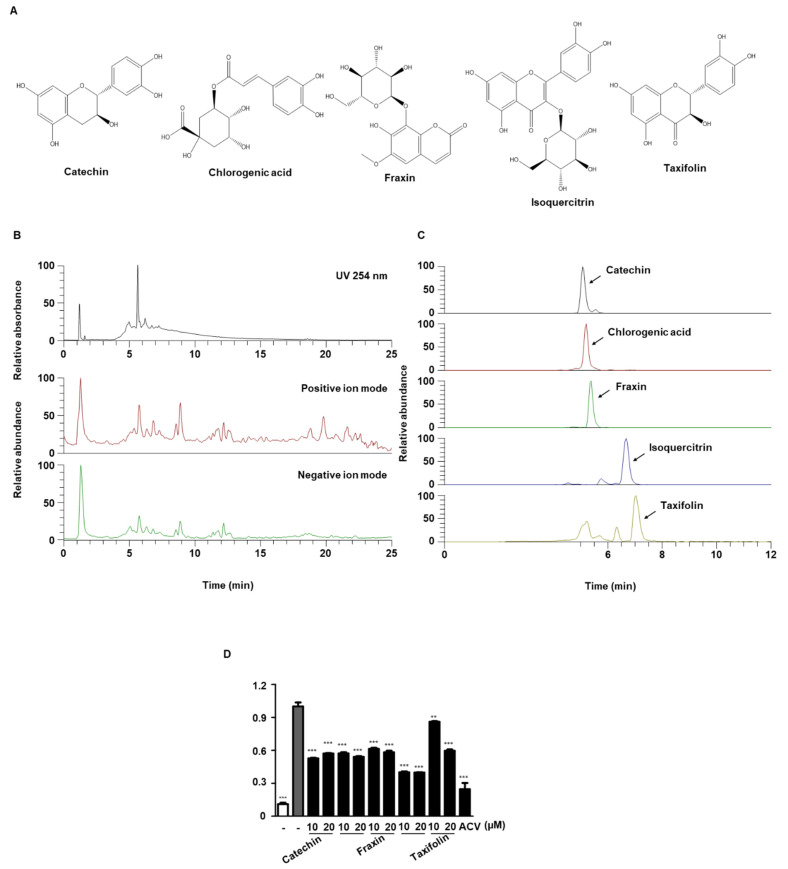
Figure 7.
UPLC-DAD-MS/MS analysis of QA. (A) Single compound structure of QA. (B) UV chromatogram and TIC of QA, (C) EIC of the identified phytochemicals in QA. (D) SK-N-SH cells were infected with HSV GFP for 2 h and treated with five phytochemicals (10 and 20 μM) for 48 h. HSV GFP (MOI = 2) expression levels were analyzed by flow cytometry. The data are representative of three independent experiments and quantified as mean values ± SEM. One-way ANOVA with Tukey’s post hoc test; * p < 0.05, ** p < 0.01, *** p < 0.001, compared with the HSV-1 treatment.

