Figure 5.
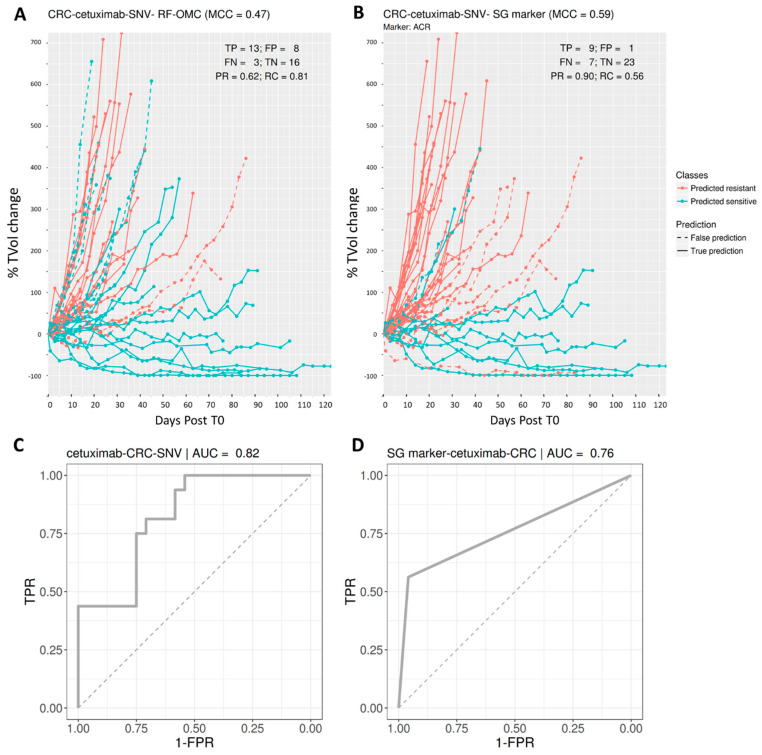
Predicting CRC PDX response to the EGFR inhibitor cetuximab. (A,B) Visualisation of tumour response prediction for test PDXs. (A) Cetuximab (4 fts): RF-OMC predicts CRC tumour response to cetuximab by optimally combining the mutational states of four genes (ACR, DENND4B, NOTCH1 and RPL22). Again, a high level of predictive accuracy was achieved on PDXs not used to train the model: MCC = 0.47 (PR = 0.62 and RC = 0.81). (B) Cetuximab (1 fts): Using the same input data and evaluation protocol, the best single-gene marker of cetuximab sensitivity was the mutational state of ACR. The RF-OMC model provided a slightly lower level of prediction than that of this standard single-gene procedure: MCC = 0.59 (PR = 0.90 and RC = 0.56). (C,D) ROC curves and their AUC values to compare the discrimination offered by both models across all possible operating thresholds. The corresponding AUC value was indicated on the top of the ROC curve. This alternative performance metric now assigns a slightly higher predictive performance to the multi-gene RF-OMC model. As the opposite outcome was obtained with MCC with the default 0.5 threshold, it is expected that optimising this threshold would lead to a more predictive RF-OMC model.

