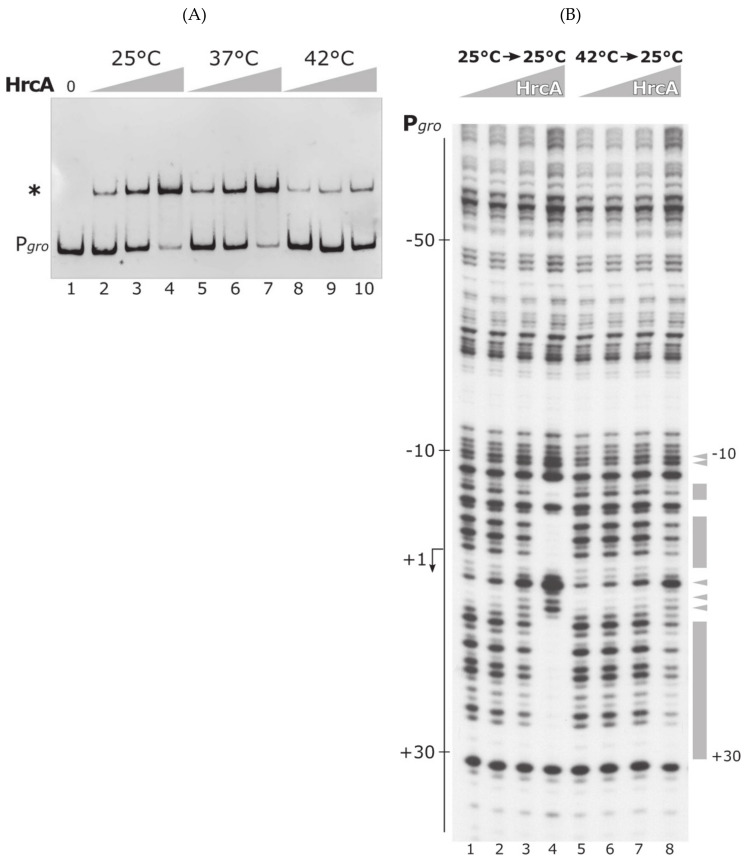
Figure 5.
DNA-binding experiments of HrcA exposed to different temperatures and recovered at 25 °C. (A) EMSA carried out with purified HrcA on Pgro promoter probe. DNA–protein complexes were allowed to form for 10 min at 25 °C, then reactions were moved to different temperatures (25, 37 or 42 °C) for 10 min. Following heat-challenge, reactions were incubated at 25 °C for a 10-min recovery step [26]. On the left, an asterisk marks the HrcA shifted band, while the label “Pgro” indicates the free probe. Lanes 1–4 contain 0, 45, 90 and 180 nM HrcA, respectively. Lanes 4–6 and 8–10 contain the same increasing concentrations of HrcA as in samples 2–4. Grey triangles indicate increasing amounts of HspR at the indicated temperatures; 0, no protein added. (B) DNase I footprinting assays with HrcA on Pgro labeled probe. Protein–DNA mixes were incubated for 10 min at 25 °C, then moved to 25 or 42 °C for 10 min, followed by a recovery step at permissive (25 °C) temperature, before DNase I cleavage. Lanes 1–4 and 5–8 contain 0, 45, 90 and 180 nM HrcA, respectively. On the left of the autoradiograph, the numbers refer to the positions with respect to the transcriptional start site (indicated by a bent arrow). Protected regions and DNase I hypersensitive sites are indicated on the right by grey boxes and arrowheads, respectively, together with positions delimiting the HrcA binding site. Grey triangles are as in panel a. Symbol * indicates the HrcA shifted band.

