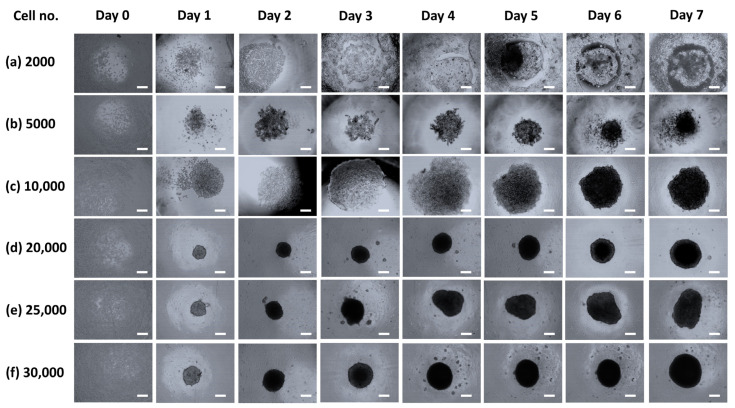
Figure 2.
Representative images for cell number optimization; images were captured after each interval of 24 h until 168 h. (a) Growth pattern of 2000 cells indicated a failed spheroid formation, (b) 5000 cells showed cellular clumps until 96 h, which later transformed into spheroids. (c) 10,000 cells successfully indicated spheroid formation after 24 h in comparison with 2000 and 5000 cells. (d) 20,000 cell number was found to be the optimum cell number for proper spheroid formation. (e,f) 25,000 and 30,000 cell numbers exhibited spheroid formation similar to the cell concentration of 20,000 cells. (Scale: 100 μm).

