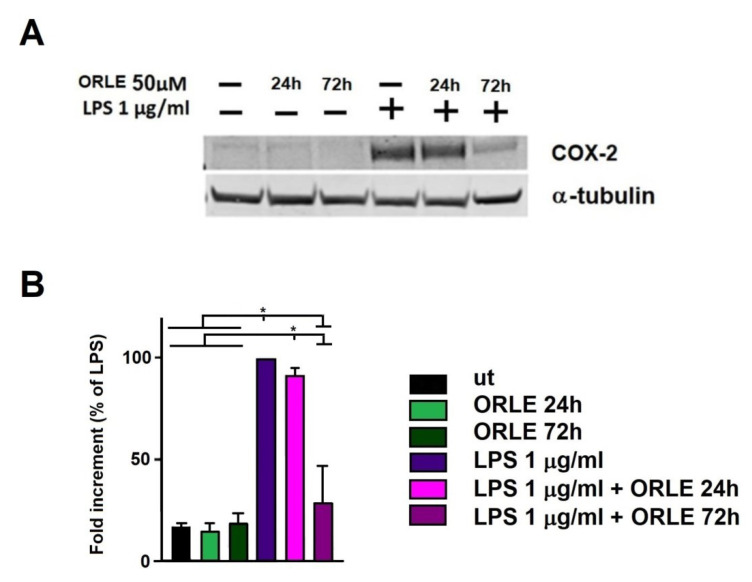
Figure 5.
Inhibition of COX-2 expression. (A) Representative Western blot of inducible cyclooxygenase-2 (COX-2) protein expression; (B) densitometric analysis of COX-2 expression in RAW.264.7 cells. Data are expressed as means ± SEM of percentage compared to LPS-stimulated cells from at least three independent experiments. Two-way-ANOVA of the data shows a statistical significance for the effect of LPS (p < 0.005). Post-hoc analysis of the differences between different groups (Tukey’s) shows a significant difference as indicated by the asterisks (* p < 0.0001).

