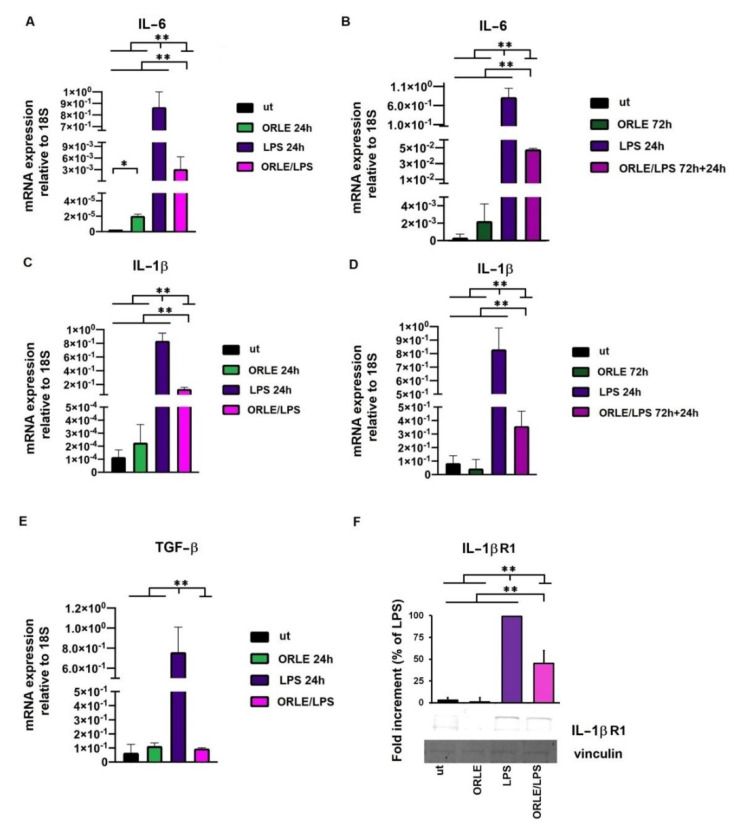
Figure 6.
Evaluation by quantitative real-time PCR of IL-6 mRNA (panel (A) for ORLE acute, and panel (B) for ORLE chronic exposure), and IL-1β mRNA (panel (C) for ORLE acute, and panel (D) for ORLE chronic exposure) in RAW264.7 cells. Quantitative real-time PCR of TGF-β mRNA in RAW264.7 cells exposed to ORLE acute treatment (E). mRNA levels were normalized to 18S as an endogenous control. Two-way-ANOVA of the data shows a statistical significance for the effect of ORLE treatment (p: 0.001), and for the effect of LPS (P: 0.002). Post-hoc analysis of the differences between different groups (Tukey’s) shows a significant difference as indicated by the asterisks (* p < 0.01 and ** p < 0.0001). IL-1R1 protein expression and relative densitometric analysis in RAW264.7 cells exposed to ORLE acute treatment (F). Data are expressed as reduction relative to LPS. Western blot images are representative of at least three independent experiments. Two-way-ANOVA of the data shows a statistical significance for the effect of ORLE treatment, and for the effect of LPS (p: 0.001). Post-hoc analysis of the differences between different groups (Tukey’s) shows a significant difference as indicated by the asterisks (** p < 0.0001).

