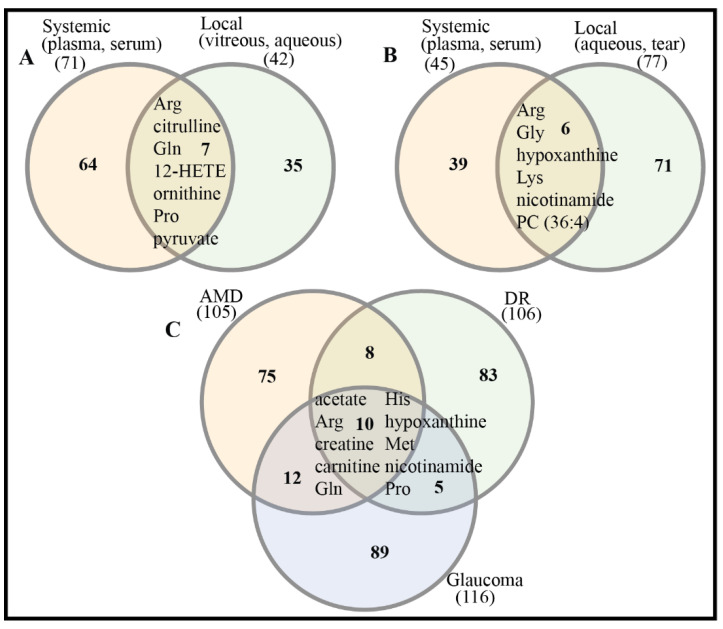
Figure 2.
Comparison of differential metabolites/potential biomarkers across samples and retinal diseases. (A) Systemic and local samples of DR. Differential metabolites/potential biomarkers are listed in Table 2. (B) Systemic and local samples of glaucoma. Differential metabolites/potential biomarkers are listed in Table 4. (C) Three retinal diseases: AMD, DR, glaucoma. Venn plot was drawn by online tool InteractiVenn [153].

