Figure 7.
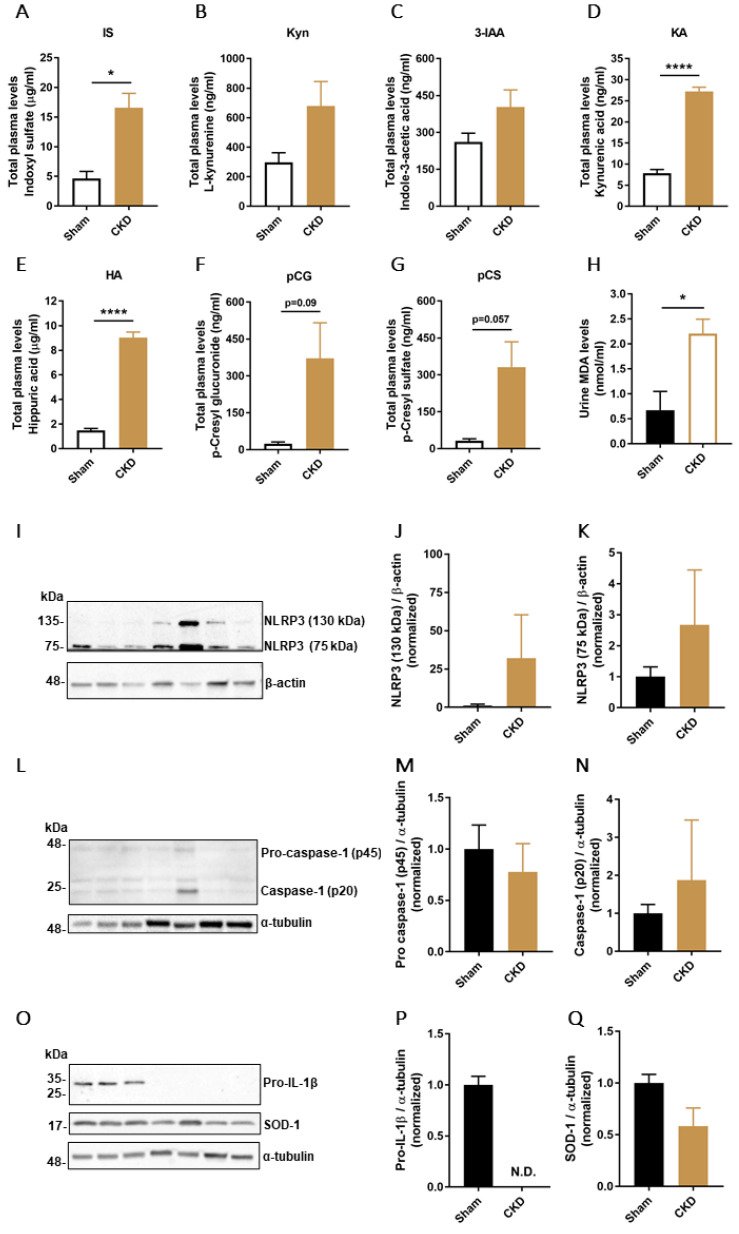
PBUTs plasma levels, oxidative damage and NLRP3 inflammasome components protein expression in CKD model. Quantification of total plasma levels (μg/mL or ng/mL) of (A) indoxyl sulfate (IS), (B) L-kynurenine (Kyn), (C) Indole-3-acetic acid (3-IAA), (D) kynurenic acid (KA), (E) hippuric acid (HA), (F) p-cresyl glucuronide (pCG) and G) p-cresyl sulfate (pCS) in Sham and CKD rats. (H) Urine MDA levels (nmol/mL) in Sham and CKD animals. (I–K) Representative Western blot and quantification of relative expression of NLRP3 in Sham and CKD rats; normalized to β-actin. (L–N) Representative Western blot and quantification of relative expression of pro-caspase-1 (p45) and caspase-1 (p20) in Sham and CKD rats; normalized to α-tubulin. (O) Representative Western blot of pro-IL-1β and SOD-1 in Sham and CKD rats. Quantification of relative expression of (P) pro-IL-1β and (Q) SOD-1; normalized to α-tubulin. Data are derived from n = 3 Sham and n = 4 CKD animals and presented as mean ± SEM. * p < 0.05, **** p < 0.0001 (Unpaired t-test).

