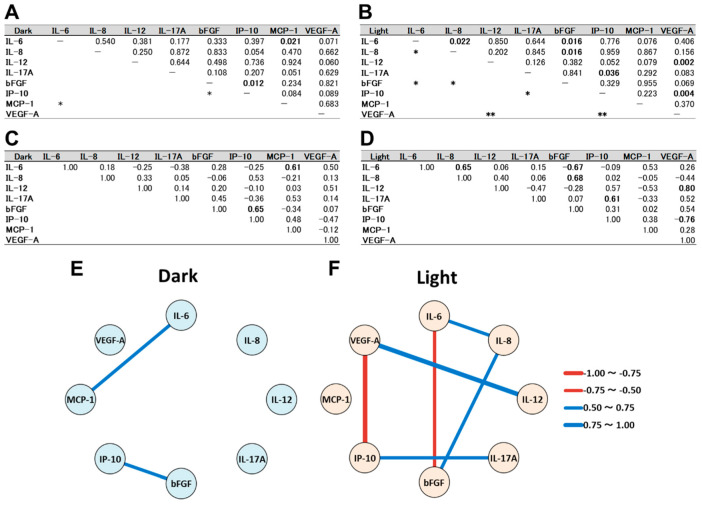
Figure 1.
Correlation between inflammatory cytokine levels in the culture supernatant of ARPE-19 cells using Pearson’s correlation analysis. (A,B) p values and (C,D) Pearson’s correlation coefficients in the correlation analysis between the cytokine levels in (A,C) dark culture and (B,D) light-irradiated culture are shown. Undirected graphs indicate significant correlations between the cytokine levels in (E) dark culture and (F) light-irradiated culture. The red line exhibits a negative correlation, and the blue line means a positive correlation. The thickness of the lines denotes the magnitude of the correlation coefficient. *: p < 0.05, **: p < 0.01.

