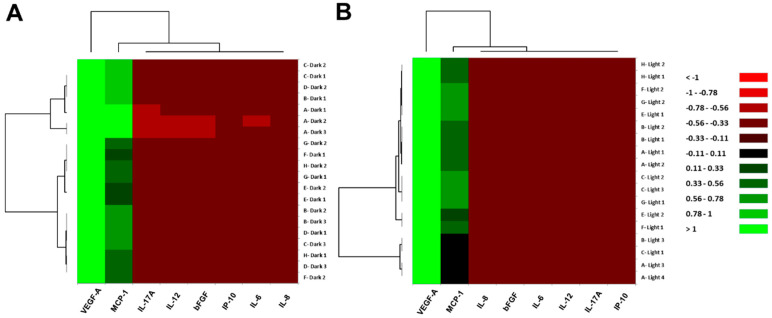
Figure 2.
Hierarchical cluster analysis of inflammatory cytokine expression patterns in the culture supernatant of ARPE-19 cells. Heat maps of the cytokines in (A) dark culture and (B) light-irradiated culture are shown. The vertical axis indicates each experimental culture (uppercase letter alphabet: plate title; numeral: well number), and the horizontal axis denotes individual cytokines. Color scale: red colors mean low values, and black to green colors exhibit middle to high values.

