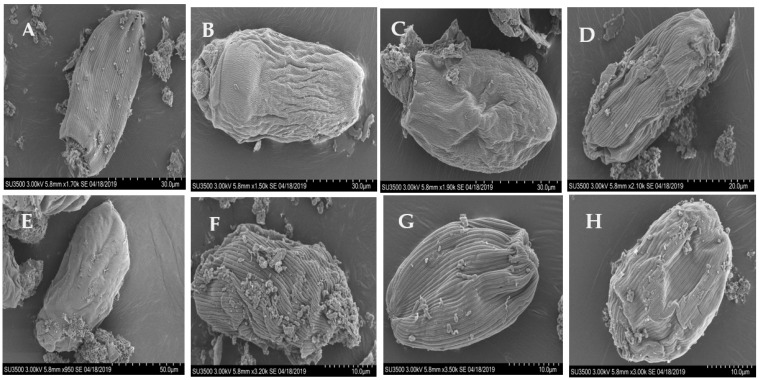
Figure 3.
Scanning electron micrographs of Entodinium cells in the in vitro cultures after 24 h of incubation. (A) control, no plant inclusion, (B) Brassica rapa subsp. chinensis, (C) Kalimeris indica, (D) Calotropis gigantea, (E) Adansonia digitata, (F) Portulaca oleracea, (G) Flemingia macrophylla (roots), and (H) Flemingia macrophylla (leaves). The cells surface changes were observed at the highest tested dose (1.1 mg/mL) for each plant. No morphological changes to the cell surfaces were observed at the two lower doses or the negative control (not shown).

