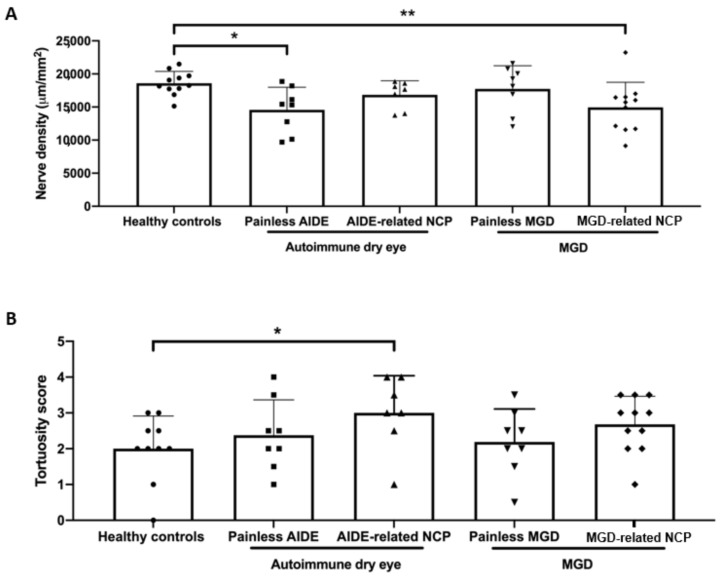
Figure 5.
(A) Corneal nerve density (expressed as total nerve length in μm per mm2) in the various study groups. Intergroup comparisons were made using an unpaired t-test; (B) corneal nerve tortuosity (expressed as mean tortuosity score, as defined in Figure 2). Intergroup comparisons were made using Mann–Whitney U test. Statistical significance was illustrated as follows: * p < 0.05, ** p < 0.01.

