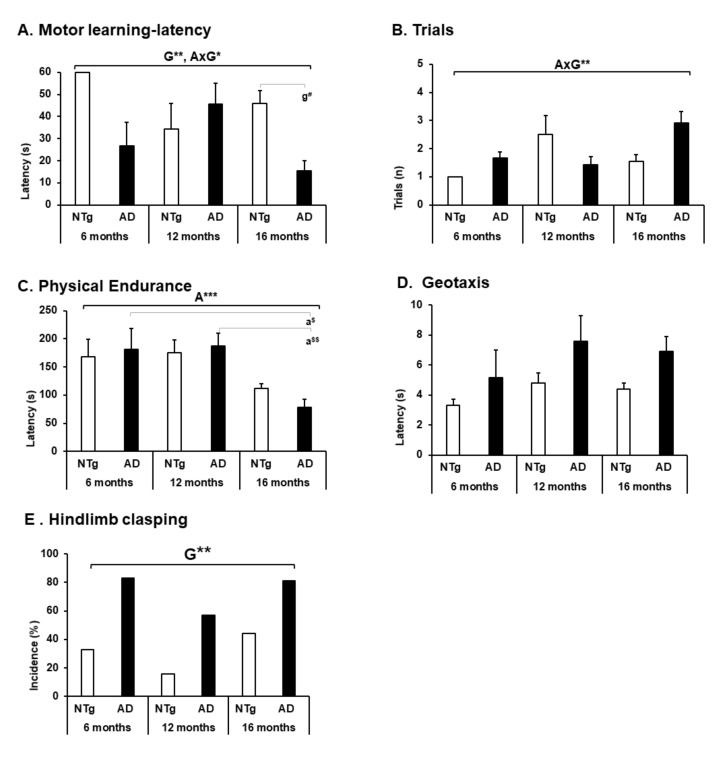
Figure 7.
Motor performance, geotaxis and hindlimb clasping. (A) Motor learning—latency; (B) trials; (C) physical endurance; (D) geotaxis; the results are expressed as mean ± SEM. Statistics: one-way ANOVA, Age effect expressed as (A); Genotype effect expressed as (G); Genotype and Age interaction effect are expressed as (GxA). * p < 0.05, ** p < 0.01, and *** p < 0.001 followed by post hoc Bonferroni test, # p < 0.05; differences between age in 3xTg-AD group are expressed (a): $ p < 0.01, $$ p < 0.01.(E) Hindlimb clasping; the results are expressed as prevalence (%). Statistics: Fisher’s exact test; Age effect is expressed as (A); Genotype effect is expressed as (G); Genotype,* p < 0.05.

