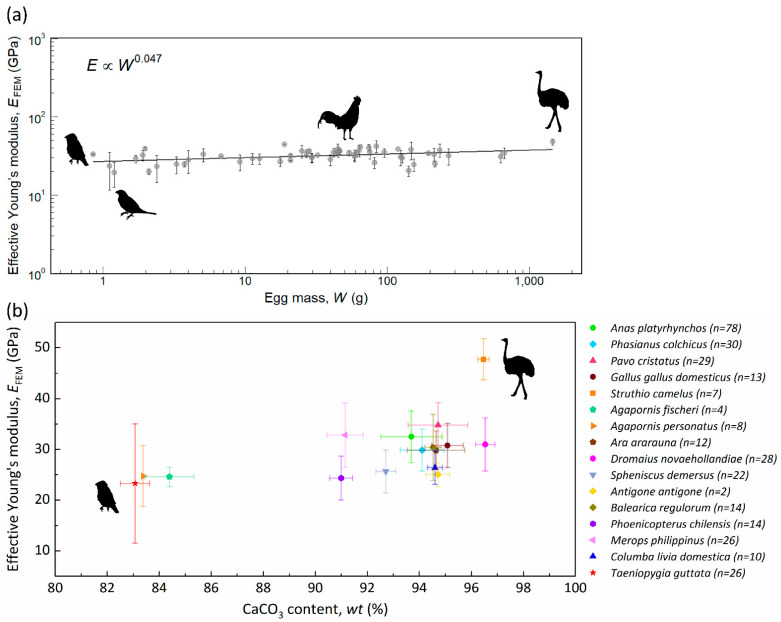
Figure 2.
(a) Effective Young’s modulus, EFEM. One point represents one avian species, and the error bars are the intraspecific standard deviations. The silhouettes from left to right are zebra finch (Taeniopygia guttata), society finch (Lonchura striata domestica), domestic chicken (Gallus gallus domesticus), and ostrich (Struthio camelus). (b) The relation between the effective Young’s modulus and the weight percentage of CaCO3, and the error bars are the standard deviations. The number, n, is the specimen amount calculated for the effective Young’s modulus.

