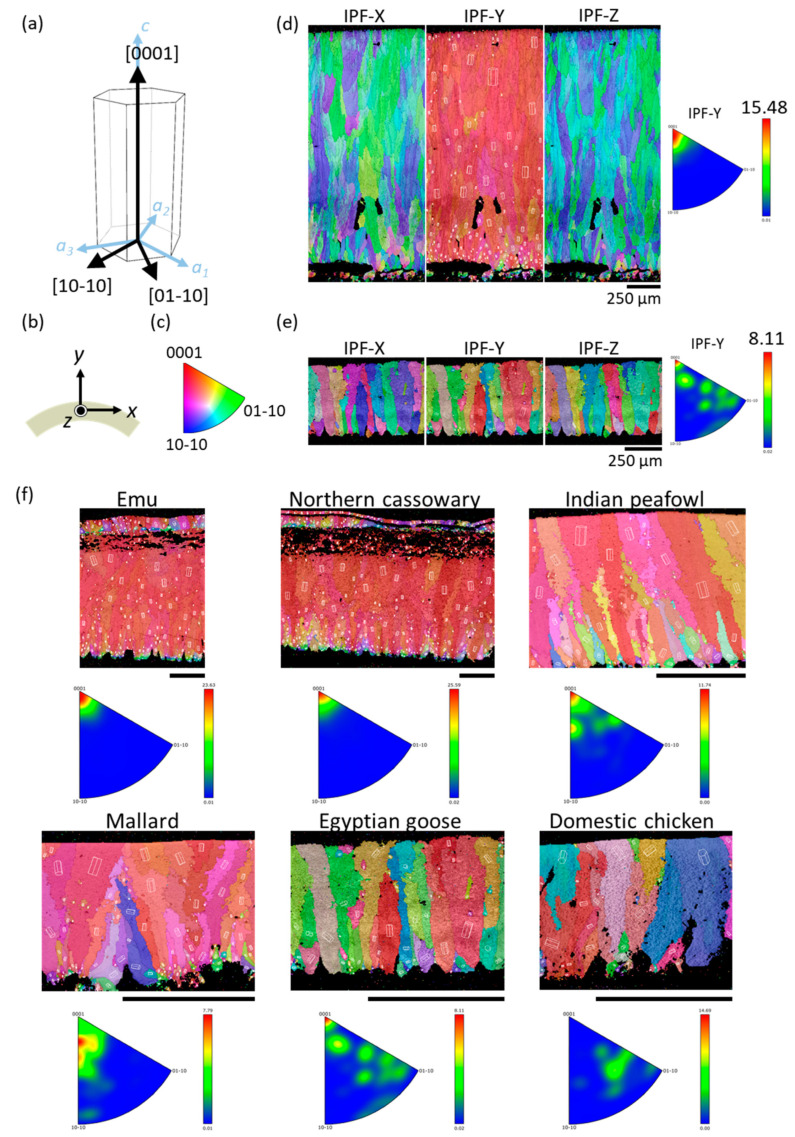
Figure 4.
(a) Schematic diagram of calcite unit cell orientation with the Miller–Bravais indices. (b) The scanning direction of EBSD on a polished eggshell cross-section. The eggshell specimens under the Cartesian coordinate with y-axis pointing to the normal direction of the eggshell. The x- and z-axes are parallel to the eggshell surface. (c) An IPF map key shows the relationship between the color and the orientation. (d,e) The IPF maps of avian eggshell obtained by EBSD. (d) Ostrich; (e) gray junglefowl. (f) The IPF-Y maps and corresponding inverse pole figures of avian eggshell obtained by EBSD. The scale bars are 250 μm.

