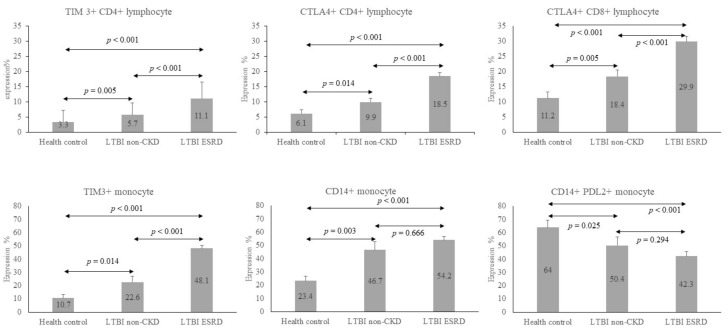
Figure 1.
Bar chart to illustrate the expression status of selected immune checkpoints and CD14+ monocytes of health control (HC), LTBI-non-CKD, and LTBI-ESRD. The number in the bars were the mean and the error lines represented mean of standard deviation. ↔ meant comparison of two groups. Only the percentages of TIM3 and CTLA-4 expression on CD4+ cells (TIM3+CD4+ and CTLA-4+CD4+), CTLA-4+CD8+, and TIM3+ monocytes were significantly higher in the LTBI-ESRD group than in the LTBI-non-CKD group. They also were significantly higher in LTBI-non-CKD than HC. CD14+ expression of monocyte was significantly higher in HC than LTBI-non-CKD, but not in LTBI-ESRD. On the contrast, PDL2+ CD14 expression of monocytes were significantly higher in LTBI-non-CKD, compared to HC. The data between various groups were compared by Mann–Whitney U test.

