Figure 1.
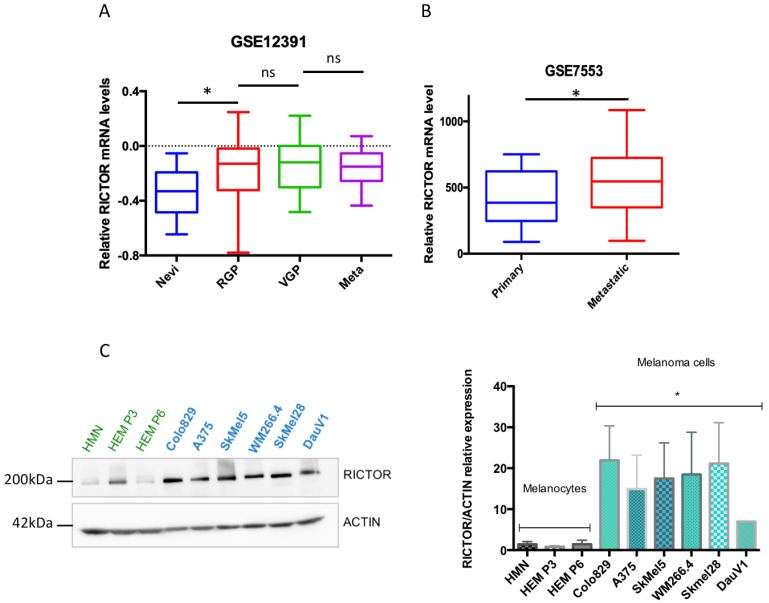
RICTOR expression in human melanocytes and melanoma cells and tissues. (A) Bio-informatic analysis of RICTOR expression at the mRNA level in human nevi (Nevi; n = 31), radial growth phase (RGP; n = 11), vertical growth phase (VGP; n = 25), and metastasis melanoma (Meta; n = 5). GSE12391 raw data were compared using the Mann–Whitney test. * p < 0.05. (B) Bio-informatic analysis of RICTOR expression at the mRNA level in human primary melanoma (Primary; n = 14) and metastasis melanoma (Metastatic; n = 40). GSE7553 raw data were compared using the Mann–Whitney test. * p < 0.05. (C) RICTOR protein expression was assessed by Western blotting in melanocytes (three independent donors, in green) and six melanoma cell lines mutated on BRAF (in blue). β-Actin served as a loading control. RICTOR protein expression was quantified on three independent experiments and normalized with β-Actin expression. The graph represents the means ± s.d. RICTOR expression in the three melanocytes cell lines was compared to its expression in the six melanoma cell lines using the unpaired Student’s t-test: * p = 0.0022.

