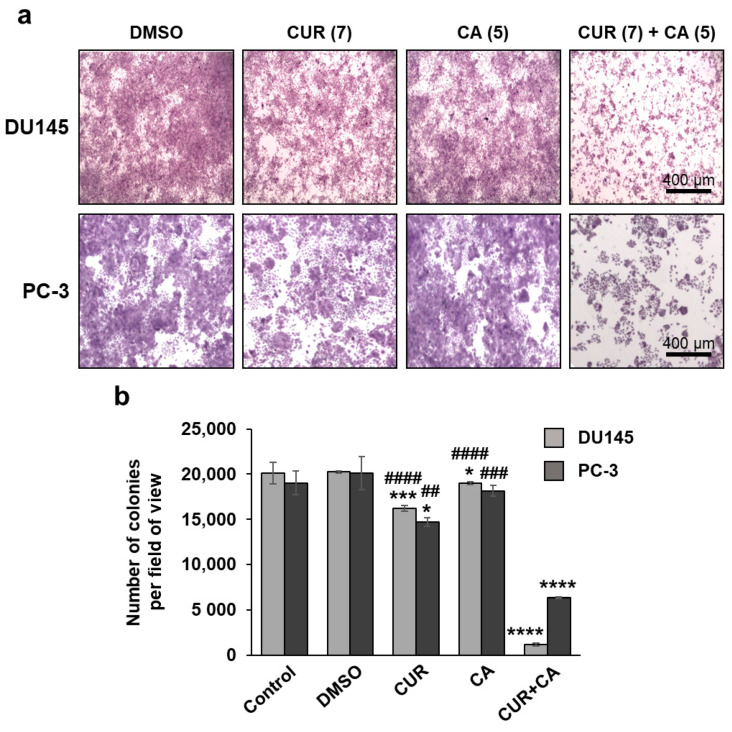
Figure 3.
Colony formation analysis of the effects of curcumin and carnosic acid on cell growth. (a) Representative images of Crystal Violet-stained cell colonies obtained after 7 days of cell exposure to the indicated concentrations (in μM) of curcumin (CUR), carnosic acid (CA) and their combination (CUR + CA). Magnification: 40×; scale bar: 400 µm. (b) Quantitative evaluation of the colony formation data. The data are presented as averaged numbers of colonies per microscopic field of view (mean ± SEM; n = 3). Statistically significant differences for CUR, CA or CUR + CA vs. DMSO (* p < 0.05; *** p < 0.001 and **** p < 0.0001) and for CUR or CA applied separately vs. CUR + CA (## p < 0.01; ### p < 0.001 and #### p < 0.0001).

