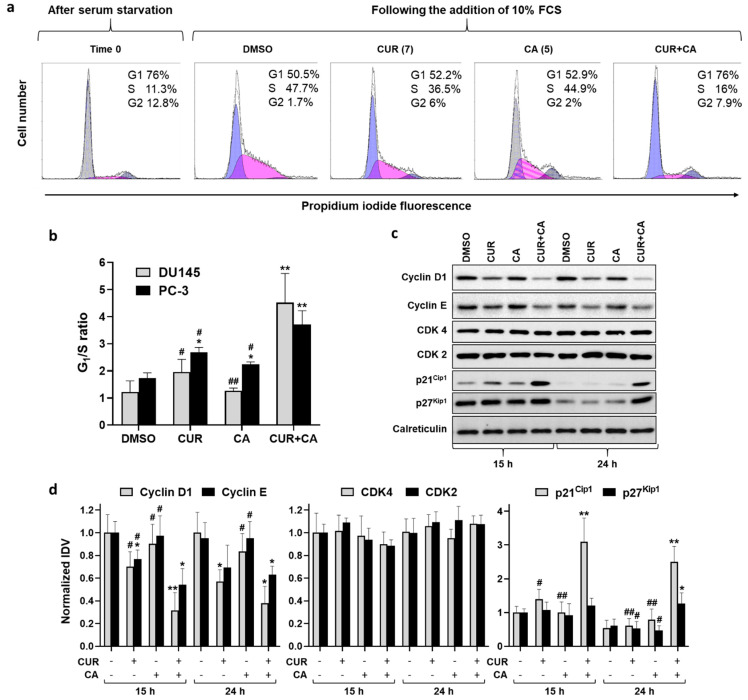
Figure 4.
Modulation of cell cycle by curcumin, carnosic acid and their combination. (a) Representative flow cytometric data demonstrating inhibition of cell cycle progression in DU145 cells under the indicated treatment conditions (24 h). Values given in parentheses are concentrations (μM). (b) Quantitative data showing inhibition of G1/S cell cycle transition. (c) Expression profile of cell cycle regulatory proteins. (d) Quantitative analysis of the protein expression data. Integrated Density Values (IDVs) of the indicated protein bands normalized to IDVs of respective calreticulin bands are shown. All IDV ratios are relative to that of the control (DMSO) sample at 15 h assumed as 1.0. Data are presented as mean ± SD (n = 3). Statistically significant differences for CUR, CA or CUR + CA vs. DMSO (* p < 0.05 and ** p < 0.01) and for CUR or CA vs. CUR + CA (# p < 0.05 and ## p < 0.01) determined separately at 15 h and 24 h.

