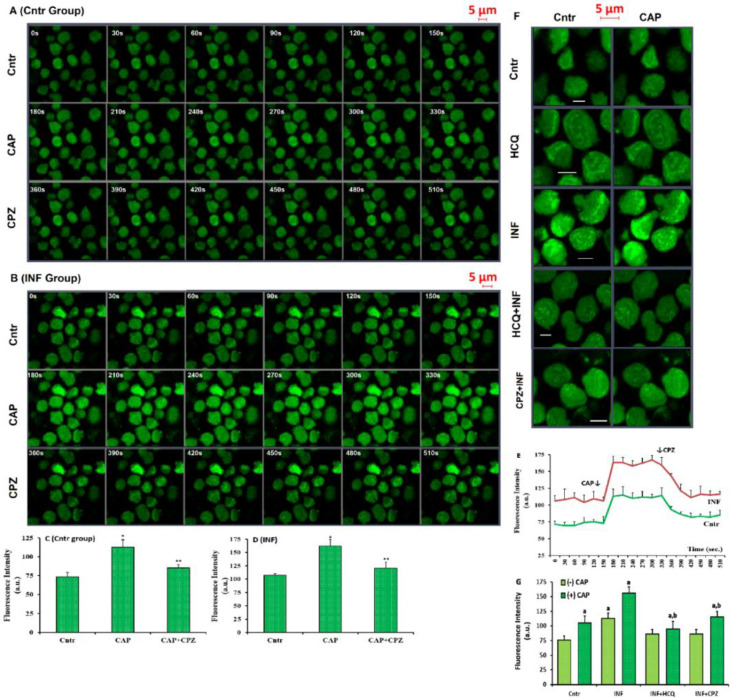
Figure 5.
HCQ (60 μM for 16 h) modulated acute INF-caused increase of cCa2+ concentration in the U937 monocytes. (Mean ± SD). The cells were stained with Fluo 3-AM (1 μM for 1 h). The monocytes were stimulated by CAP (10 μM for 150s) and then, they were inhibited by CPZ (0.1 mM for 150s) in the confocal microscope (LSM800) with 40 × 1.3 oil objective. (A,B) Fluo 3-AM imaging and mean Ca2+ fluorescence intensity (arbitrary unit, a.u.) in the Cntr and INF groups, respectively. The capture time (second) of each image was indicated in the corner of each image by white numbers. (C,D) The mean concentrations of Ca2+ fluorescence intensities were indicated in the (A,B) by columns. (E) Fluo -3-AM images in the five groups (Cntr, HCQ, INF, HCQ + INF, and CPZ + INF). (F,G) The mean column graphics of Ca2+ fluorescence intensity in the Cntr and INF, respectively. The scale bar was kept as 5 µm. * p ≤ 0.05 vs. Cntr. ** p ≤ 0.05 vs. INF. a p ≤ 0.05 vs. CAP stimulation (-CAP). b p ≤ 0.05 vs. CAP stimulation (+CAP).

