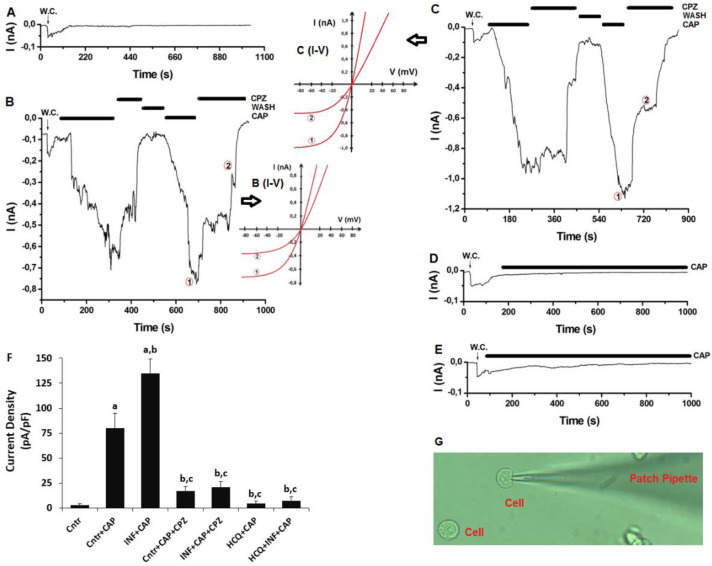
Figure 6.
HCQ (60 μM for 48h) treatment modulated to the acute INF (LPS and 1 μg/mL for 16h)-caused upregulation of TRPV1 current densities in the U937 monocytes. (n = 3–6 and mean ± SD). The TRPV1 was activated by CAP (10 μM), although it was blocked by CPZ (100 μM). W.C.: whole cell. (A) Control (Cntr) (without CAP treatment). (B) Cntr + CAP group with the treatments of CAP and CPZ. (C) Acute INF + CAP group with the treatment of CAP and CPZ after the LPS treatment. (D). HCQ + CAP with CAP treatment after the HCQ incubation. (E) HCQ + acute INF + CAP group with the treatment of CAP and LPS after the HCQ treatment. (F) The mean densities of TRPV1 current. (G). Image of whole cell configuration. (a p ≤ 0.05 vs. Cntr. b p ≤ 0.05 vs. the group of Cntr + CAP. c p ≤ 0.05 vs. INF+CAP).

