Figure 1.
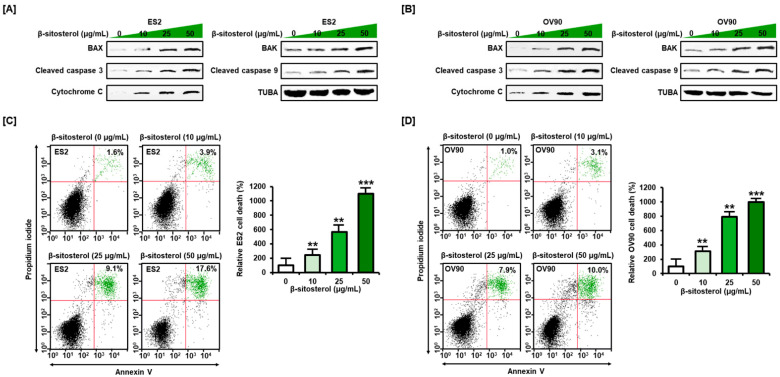
Western blot and annexin V and propidium iodide (PI) staining were performed to investigate cell death in cultures of both cell lines. (A,B) Western blot bands showing the expression of pro-apoptotic signal components in β-sitosterol (0, 10, 25, and 50 µg/mL)-treated cells. Alpha-tubulin (TUBA), used as a control, is shown at the bottom right of each figure. (C,D) Quadrants of the dot blot represent the state of cell apoptosis in ES2 (C) and OV90 (D) cells. Comparative bar graphs represent the relative change in late apoptosis following β-sitosterol treatment (0, 10, 25, and 50 µg/mL) compared to the control (100%) in ES2 and OV90 cells. The asterisks indicate significant differences between treated and control cells (*** p < 0.001 and ** p < 0.01).

