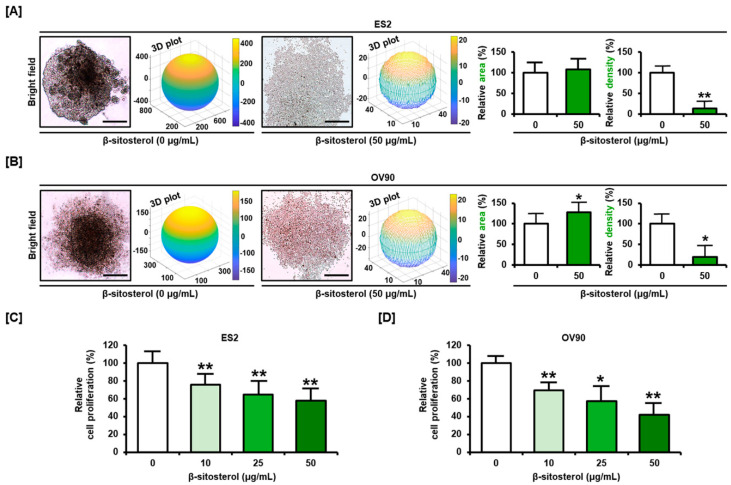
Figure 5.
Restriction of cell growth by β-sitosterol in ovarian cancer cells. (A,B) Analysis of 3D spheroid formation by ES2 (A) and OV90 (B) cells with or without β-sitosterol. (C,D) Cell proliferation assay following β-sitosterol treatment (0, 10, 25, and 50 µg/mL) for both cell lines. Comparative bar graphs represent the % of cell growth compared to the vehicle-treated control (100%) for ES2 (C) and OV90 cells (D). The asterisks indicate significant differences between treated and control cells (** p < 0.01, and * p < 0.05).

