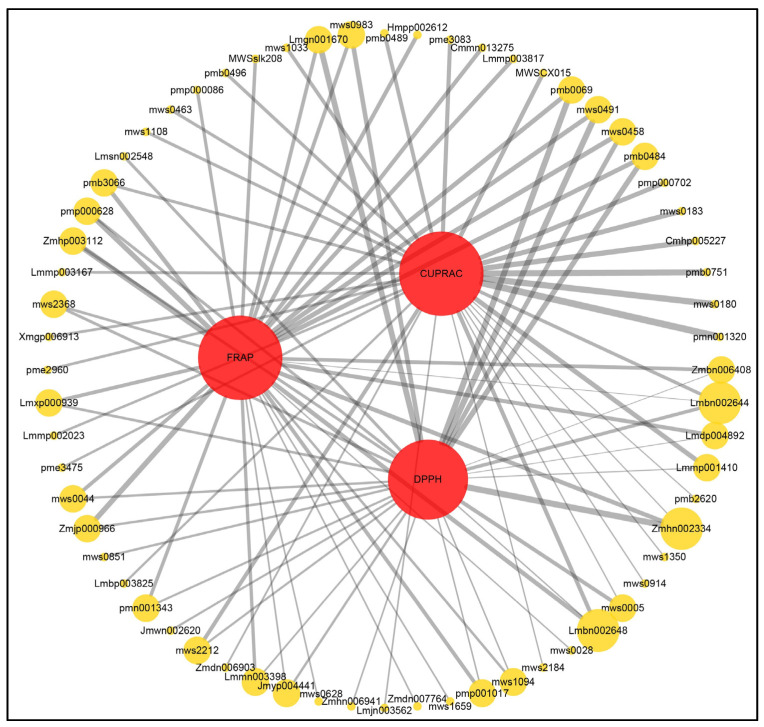
Figure 4.
Network diagram between antioxidant capacity and metabolites. Red circles indicatedifferent antioxidant capacity (DPPH: 2,2-diphenyl-1-picrylhydrazyl radical scavenging ability; FRAP: ferric reducing antioxidant power; CUPRAC: cupricion reducing capacity.), yellow circles indicate different metabolites (The number above the circle indicates the component ID of Metware), and the line connecting the two circles represents the correlation, with the thicker the line the greater the correlation coefficient (r ≥ 0.9 and p < 0.0001).

