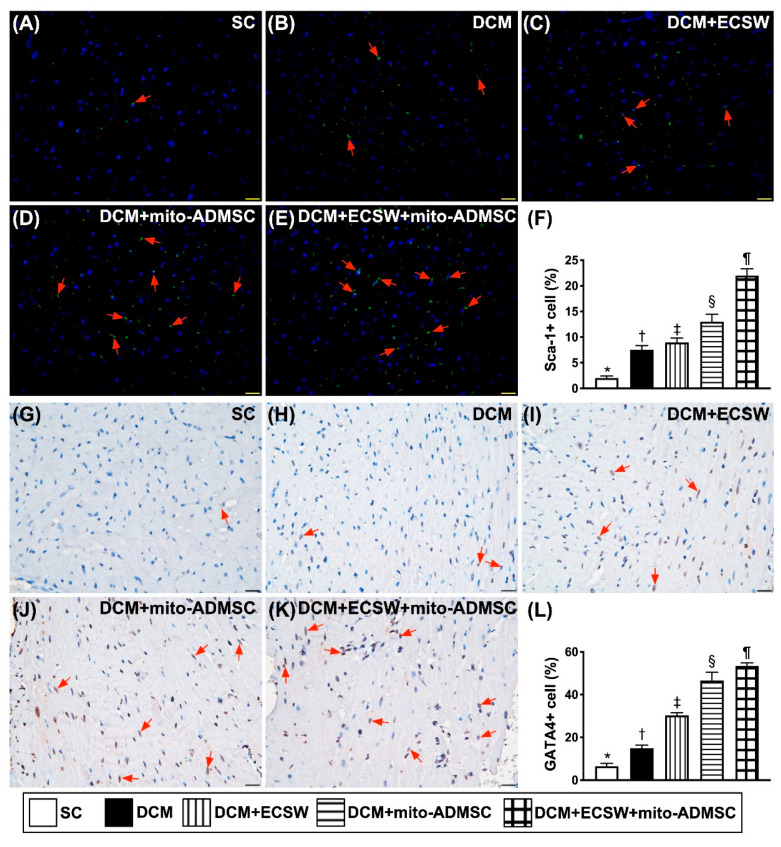
Figure 5.
Cardiac stem cells and cardiac marker were upregulated by combined ECSW-assisted mitochondrial delivery into ADMSCs + ECSW therapy in LV myocardium 7 weeks after DCM induction. (A–E) Illustrating the microscopic finding (400×) for identification of cellular expression of Sca-1 (green color) (red arrows). (F) Analytical result of number of Sca-1+ cells, * vs. other groups with different symbols (†, ‡, §, ¶), p < 0.0001. (G–K) Illustrating the microscopic finding (400×) for identification of cellular expression of GATA4 (gray color) (red arrows). (L) Analytical result of number of GATA4 + cells, * vs. other groups with different symbols (†, ‡, §, ¶), p < 0.0001. Scale bar in right lower corner represents 20 µm. All statistical analyses were performed by one-way ANOVA, followed by Bonferroni multiple comparison post hoc test (n = 6 for each group). Symbols (*, †, ‡, ¶) indicate significance (at 0.05 level). ECSW = extracorporeal shock wave; SC = sham control; DCM = dilated cardiomyopathy; mito = mitochondria.

