Figure 10.
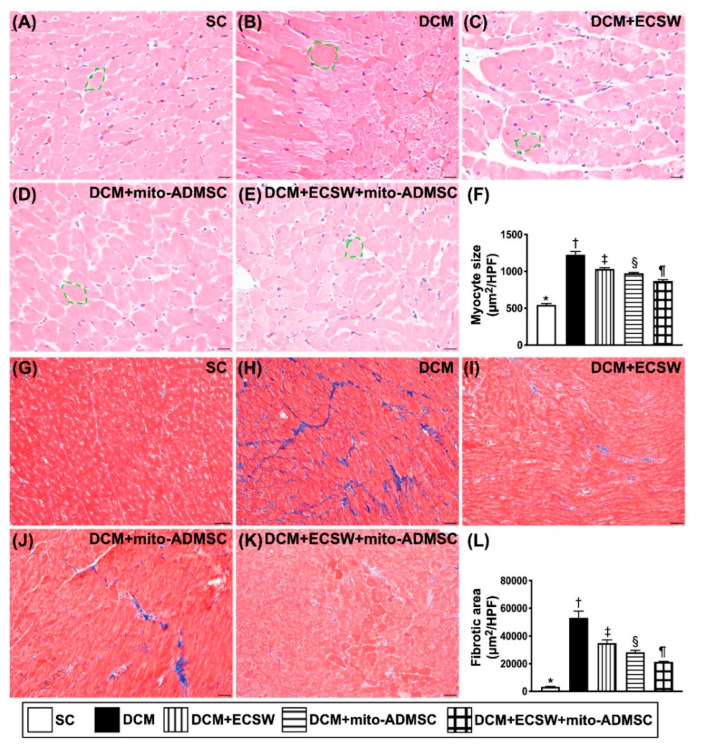
Cardiomyocyte size and cellular expression of fibrosis by day 49 after DCM induction. (A–E) Illustrating the microscopic finding (200×) of H.E. stain for identification of cardiomyocyte size (yellow dotted line). (F) Analytical result of cardiomyocyte size, * vs. other groups with different symbols (†, ‡, §, ¶), p < 0.0001. (G–K) Illustrating the immunohistochemical stain (200×) for identification of fibrosis in LV myocardium (blue color). (L) Analytical result of fibrotic area, * vs. other groups with different symbols (†, ‡, §, ¶), p < 0.0001. Scale bar in right lower corner represents 50 µm. All statistical analyses were performed by one-way ANOVA, followed by Bonferroni multiple comparison post hoc test (n = 6 for each group). Symbols (*, †, ‡, ¶) indicate significance (at 0.05 level). SC = sham control; DCM = dilated cardiomyopathy; ECSW = extracorporeal shock wave; mito = mitochondria.

