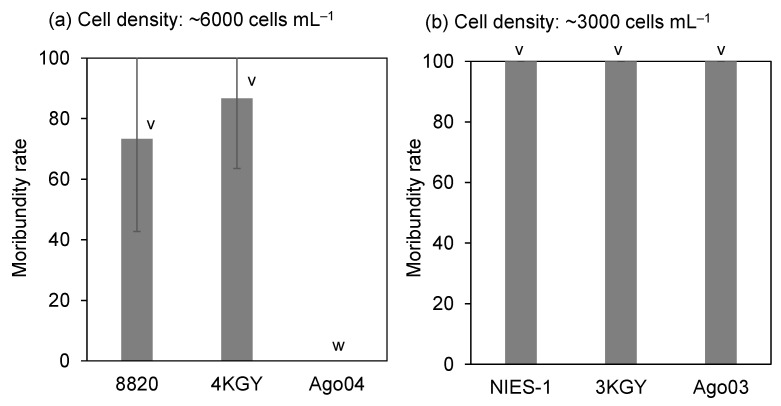
Figure 3.
Toxicity of Chattonella strains to yellowtail at different cell densities. Each bar represents the mean ± SD of triplicate measurements. Low-toxicity strains (8820, 4KGY, Ago04) (a) and highly toxic strains (NIES-1, 3KGY, Ago03) (b) were exposed to fish at cell densities of ~6000 and ~3000 cells mL−1, respectively. Means that are not significantly different are labeled with the same letter (v or w; p < 0.05).

