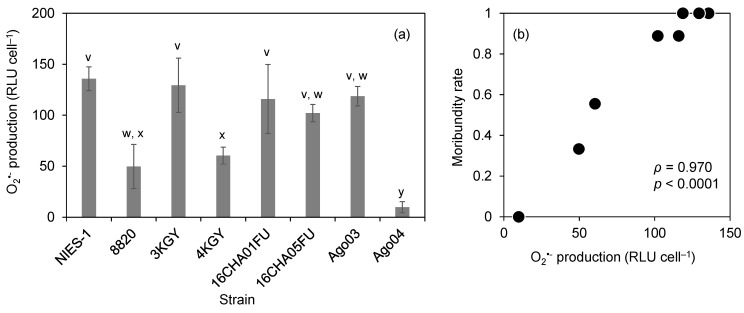
Figure 5.
Superoxide (O2•−) production levels of Chattonella strains (a) and their relationship with the moribundity rate shown in Figure 2. Data of control (no Chattonella cell) are also plotted (b). Each bar represents the mean ± SD of triplicate measurements. Means that are not significantly different are labeled with the same letter (v–y; p < 0.05). RLU, relative luminescence units.

