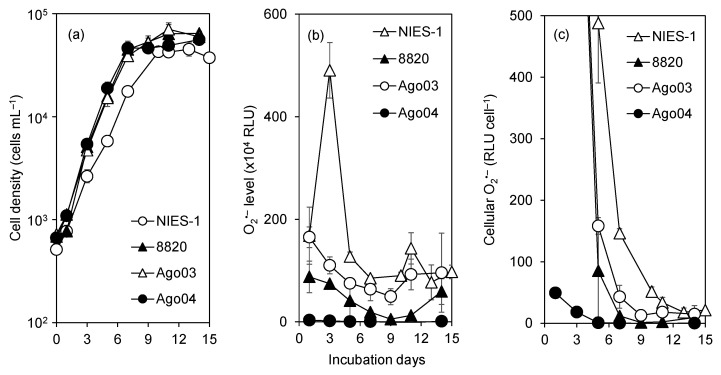
Figure 6.
Time-course variations in cell density (a), superoxide (O2•−) level in culture (b), and cellular O2•− production level (c) in two highly toxic (Ago03 and NIES-1) and two low-toxicity (Ago04 and 8820) Chattonella strains. Data points in each plot represent the mean ± SD of triplicate measurements. RLU, relative luminescence units. This experiment was conducted in the absence of fish.

