
Figure 5.
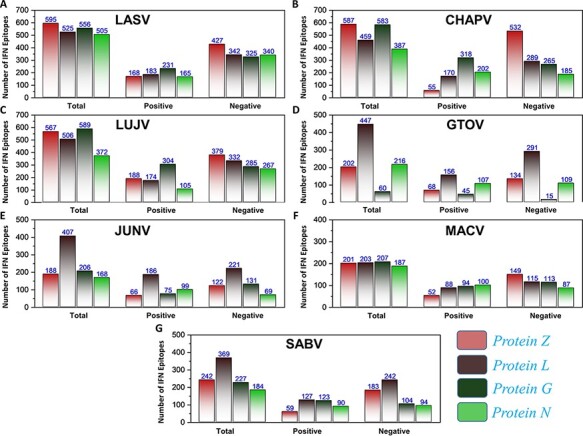
(A–G) Represents the total number of predicted IFN epitopes along with positive and negative IFNs for each protein of the seven MMVs, respectively.
Official websites use .gov
A
.gov website belongs to an official
government organization in the United States.
Secure .gov websites use HTTPS
A lock (
) or https:// means you've safely
connected to the .gov website. Share sensitive
information only on official, secure websites.
(A–G) Represents the total number of predicted IFN epitopes along with positive and negative IFNs for each protein of the seven MMVs, respectively.