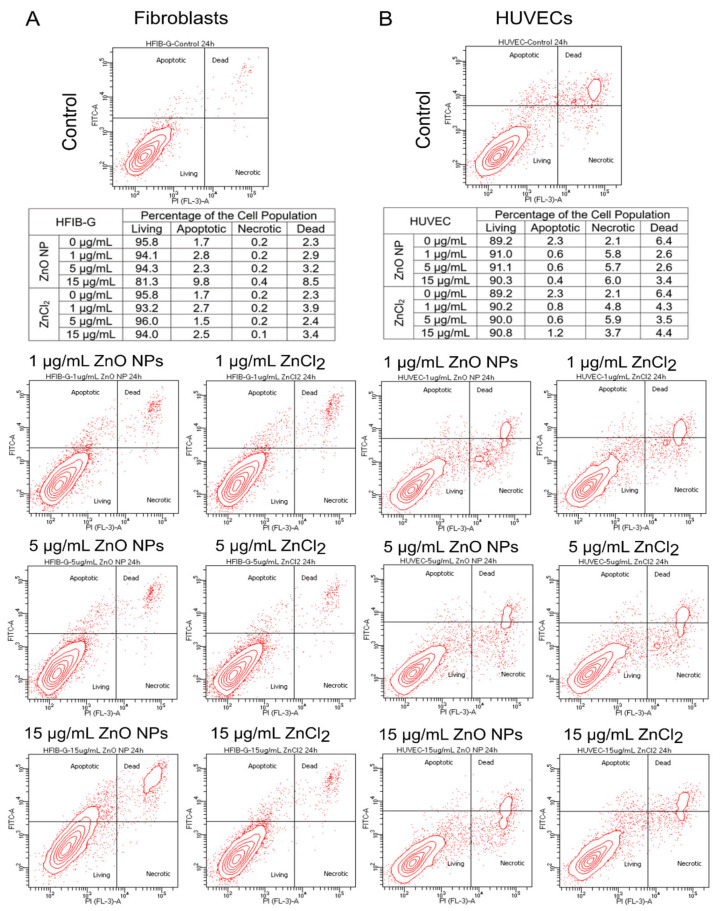
Figure 3.
Relative Proportions between Living, Apoptotic, Necrotic, and Dead Cells after Treatment with 1, 5, or 15 µg/mL ZnO NPs or Equivalent Amounts of ZnCl2 in Fibroblasts (A) and Endothelial Cell Populations (B). Whether cell death occurred following treatment with ZnO NPs or ZnCl2 was explored by detection of apoptotic, necrotic, and dead cells in the cell population via staining with propidium iodide (PI) and annexinV-FITC and subsequent flow cytometric analysis. In (A), the results from the fibroblast populations are shown, while in (B), those from the endothelial cell populations are shown. The contour blot at the top of each column shows the proportions between living, apoptotic, necrotic, and dead cells in the untreated control population. In the lower left quadrant, living cells are located; in the upper left quadrant apoptotic cells can be seen; in the upper right quadrant are dead cells; and in the lower right quadrant are necrotic cells. Underneath in the table, the raw values of the exemplary measurement are shown (N = 1). Below, the two-by-three figures show each treatment group in a contour blot individually, with the fibroblasts on the left-hand side and the endothelial cells on the right-hand side. Treatment with 1 or 5 µg/mL ZnO NPs or equivalent amounts of ZnCl2 did not lead to an increase in the proportion of apoptotic, necrotic, or dead cells in the cell populations, neither in fibroblasts nor in endothelial cells. In the range of concentrations studied here, only the treatment of fibroblasts with 15 µg/mL ZnO NPs led to an increase in the percentage of apoptotic and dead cells in the cell population.

