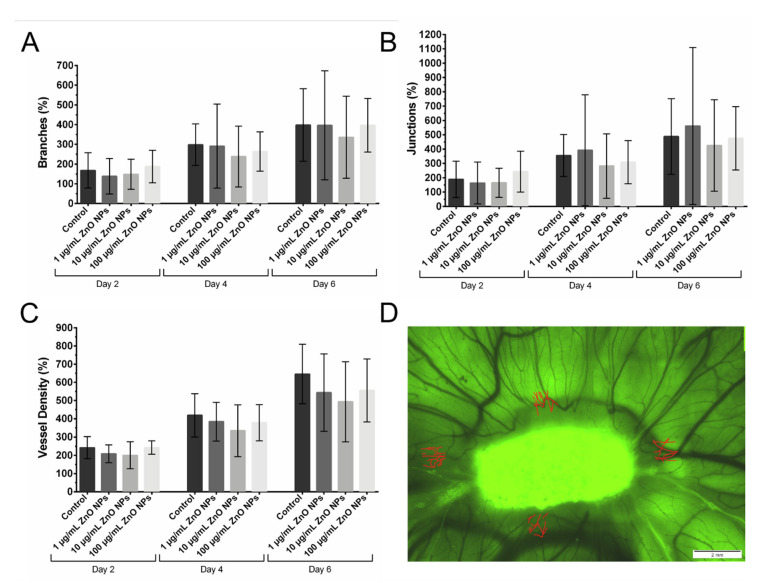
Figure 5.
Vascularization of the CAM after Exposure to ZnO NPs. The vascularization of the CAM developed rapidly from EDD 8 (day 0) to EDD 14 (day 6). The number of branches (A), junctions (B), and the vessel density (C) increased in the period under investigation in all dosage groups. All three parameters are expressed in relation to the number of branches, junctions, and vessels on day 0 (=100%) of each individual egg to account for individual development of each chicken embryo. In (D) there is shown a representative image of an egg on day 2. The gelatin sponge (in green) is beginning to be degraded, and in four ROIs next to the sponge, the vascularization was quantified. In red, the vessels detected in the ROIs can be seen. Then the number of branches, junctions, and the vessel density in all ROIs were calculated. Shown are mean values ± SD. Two-way ANOVA, comparison of each dosage group with untreated control group at the specific day, correction for multiple comparisons by Bonferroni, N = 3 (three independent runs) with 106 eggs in total being included in the analysis; eggs per dosage group ≥ 14. No significant differences were found between the different dosage groups.

