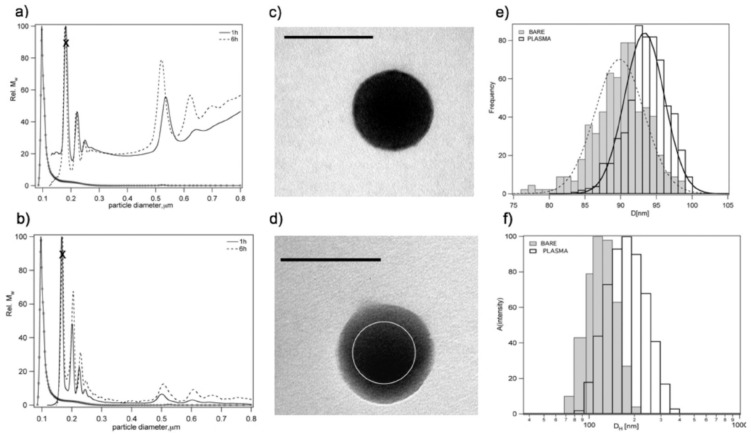
Figure 4.
(a) Differential centrifugation sedimentation results (DCS) for 100 nm PSCOOH NP–protein complexes in plasma measured after 1 h (solid line) and 6 h (dotted line) of incubation. (b) DCS results for particle–corona complexes free from excess plasma 1 and 6 h after in PBS. Bare = 100 nm. PSCOOH NPs in PBS (open circles) for reference in both graphs. The marked peaks relate to the monomeric NP–protein complexes. (c) Transmission electron microscopy (TEM) picture of bare 100 nm PSCOOH nanoparticles. Bar = 100 nm. (d) TEM picture of the protein–particle complex (free from excess plasma) for 100 nm PSCOOH NPs. (e) Size distribution histogram by size analysis of various TEM images of particles. (f) Dynamic light scattering (DLS) intensity-weighted size distributionfor 100 nm PSCOOH NPs (bare) and 100 nm PSCOOH protein–particle complexes free from excess plasma (washed corona) in PBS. Adapted, with permission, from [19]. Copyright (2020) American Chemical Society.

