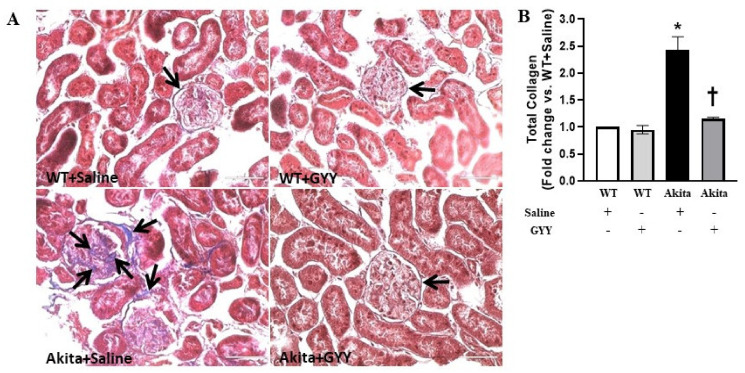
Figure 9.
GYY reduced glomerular collagen deposition in diabetic kidney. (A) Representative photomicrograph of kidney section stained with Masson’s trichrome showing predominant collagen deposition at the peri-glomerular and glomerular regions (black arrows). (B) The bar graph represents the mean fold change ± SD of total collagen area vs. WT + Saline. n = 6/group, * p < 0.05 vs. WT + Saline, † p < 0.05 vs. Akita + Saline. Magnification × 60; scale bar: 50 µm.

