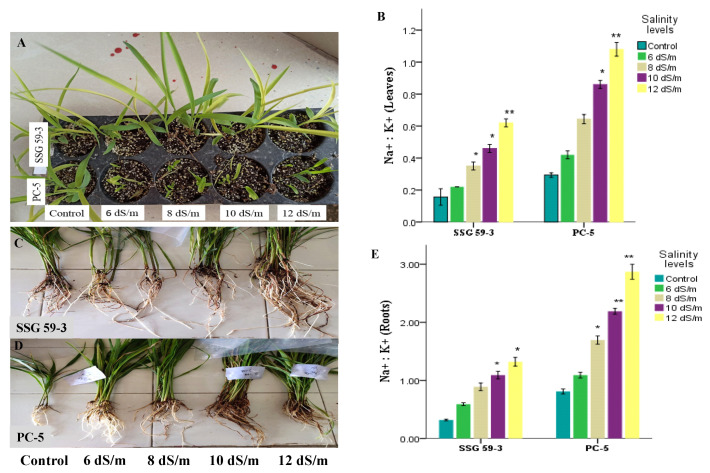
Figure 5.
Effect of salt stress on ion profiling of sorghum genotypes. (A) Seedlings of SSG 59-3 (salt-tolerant) and PC-5 (salt-sensitive) genotypes after 48 h of salt exposure, (B) Na+/K+ ratios in leaves, (C) root biomass of SSG 59-3 (salt-tolerant), (D) root biomass of PC-5 (salt-sensitive) genotype, and (E) Na+/K+ ratios in roots. All values are the means ± SD of three biological replicates. Asterisks represent significant (*) and highly significant (**) differences among different treatments.

