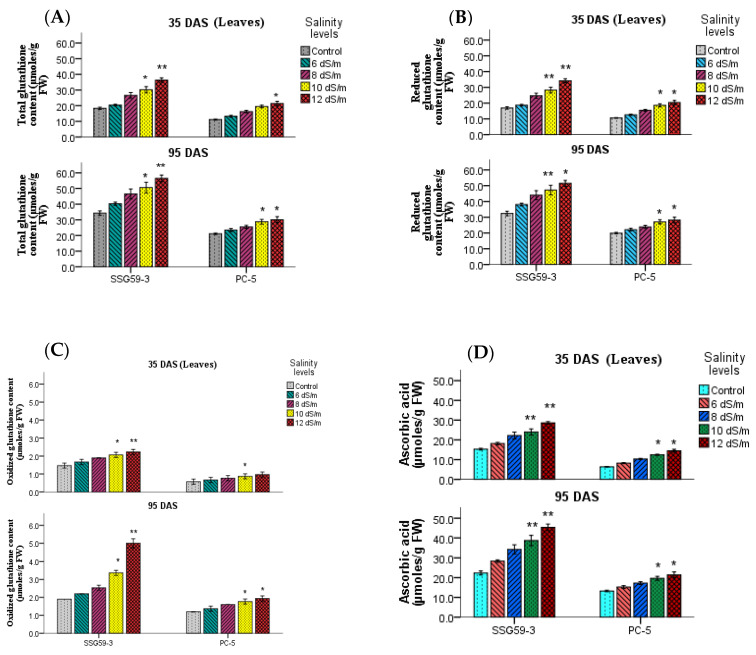
Figure 7.
Effect of salt stress on total glutathione (A), reduced glutathione (GSH, B), oxidized glutathione (GSSG, C) and ascorbic acid (ASC, D) of sorghum genotypes at 35 and 95 DAS. All values are the means ± SD of three biological replicates. Asterisks represent significant (*) and highly significant (**) differences among different treatments.

