Figure 2.
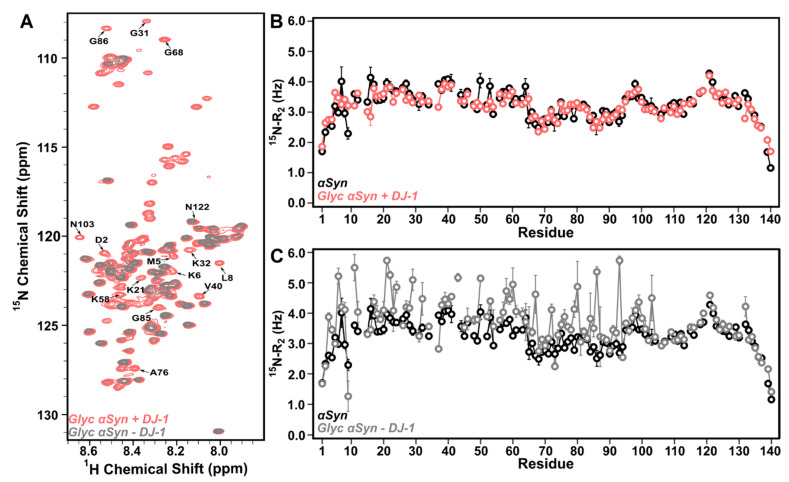
DJ-1 restores native-like character to glyc-ac-αSyn. (A) 1H–15N HSQC spectra of 250 µM 15N-glyc-ac-αSyn in the presence of 250 µM DJ-1 (red) or upon removal of DJ-1 (grey) show that peak intensities are recovered when DJ-1 is present in the sample (red) but are reduced to the levels of glyc-ac-αSyn alone once DJ-1 is removed from the sample (grey). (B) 15N-R2 values of 250 µM 15N-native ac-αSyn alone (black) or 250 µM 15N-glyc-ac-αSyn in the presence of DJ-1 (red). The backbone dynamics of glyc-ac-αSyn with DJ-1 (red) largely overlap with native ac-αSyn without DJ-1 (black), consistent with the peak intensities in the 1H–15N HSQC. (C) Upon removal of DJ-1 (grey), the backbone dynamics as measured by 15N-R2 rates revert back to resembling those of glyc-ac-αSyn alone, displaying increased 15N-R2 in the N-terminal and NAC regions relative to native ac-αSyn (black). Error bars are determined from the fitting errors of the single exponential decay fits. All samples were monitored in PBS at 15 °C.

