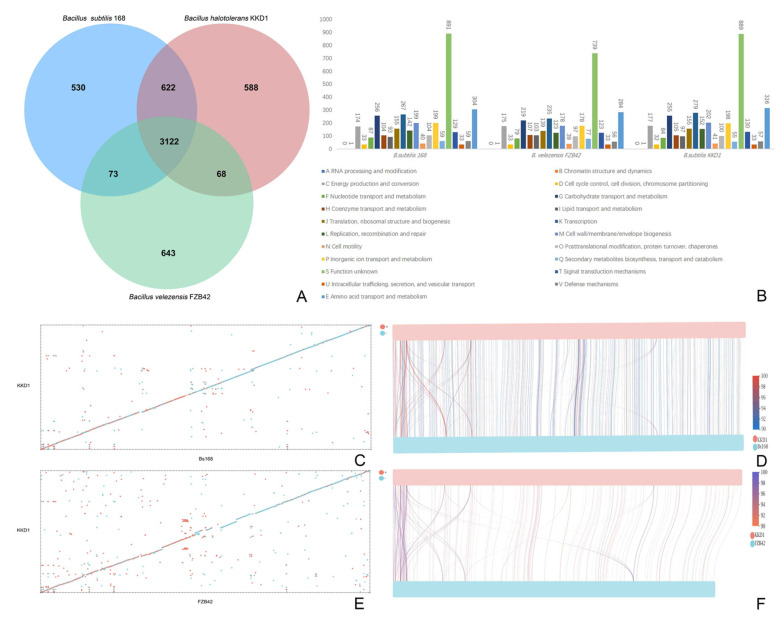
Figure 3.
Comparative genomic analysis of KKD1 with model Bacillus strains. (A) Each strain is represented by an oval. The number of orthologous genes shared by all strains (B. halotolerans KKD1, B. velezensis FZB42 and B. subtilis 168) is in the center. Numbers in nonoverlapping portions of each oval show the number of CDSs unique to each strain. (B) Genome analysis of the three strains based on the COG database. (C) A dot plot of the collinearity analysis between B. halotolerans KKD1 and B. subtilis 168. The abscissa represents B. subtilis 168, and the ordinate represents B. halotolerans KKD1. (D) The line graph of collinearity analysis between B. halotolerans KKD1 and B. subtilis 168. (E) A dot plot of collinearity analysis between B. halotolerans KKD1 and B. velezensis FZB42. The abscissa represents B. velezensis FZB42, and the ordinate represents B. halotolerans KKD1. (F) The line graph of collinearity analysis between B. halotolerans KKD1 and B. velezensis FZB42. Note: The blue dots in (C,E) represent the forward comparison of two strains, the composition and direction of the sequences are the same, and the red dots represent the reverse comparison of two samples. The sequence composition is the same, and the direction is opposite. Different colors in (D,F) indicate different regions in the samples, and the color and width of the color band indicate the alignment length and the region homology.

