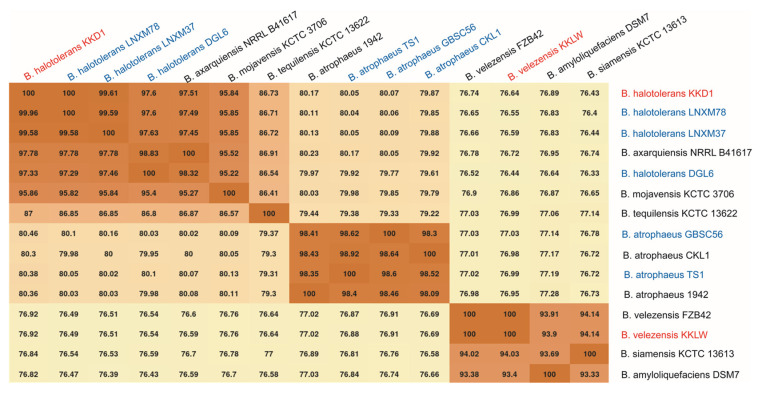
Figure 5.
Heatmap of the ANIb matrix calculated for the genomes of B. halotolerans KKD1. Heatmap of the ANIb matrix calculated for the genomes of B. halotolerans KKD1 and closely related species. The method was based on a BLASTN comparison of the genome sequences as described by Goris et al. [20]. B. halotolerans KKD1 is labelled in red letters. Strains isolated from the Qinghai–Tibetan plateau are labelled in blue letters.

